
Table of Contents
Introduction
The parliamentary committee reviewFootnote 1 of the enhancements to the Canadian Forces Members and Veterans Re-establishment and Compensation Act,Footnote 2 commonly known as the New Veterans Charter, is to be undertaken by October 2013. It will be an important opportunity for the Government of Canada, Veterans and their families, Veterans organizations and Canadians to examine how well the New Veterans Charter is living up to the expectations placed upon it by the parliamentarians who unanimously supported its enactment in 2006. They envisioned it to be a “living” charter that would evolve over time to meet the changing needs of Veterans and their families.
To support the parliamentary committee review, the Office of the Veterans Ombudsman has released a four-part publication series entitled Improving the New Veterans Charter: the Parliamentary Review. The first part, released on April 4, 2013, is a review paper that provides a factual reference point for three New Veterans Charter program areas that are of most concern to Veterans transitioning to civilian life, and their families, namely, financial, vocational rehabilitation and assistance, and family support. The second in the series entitled Investing in Veterans Vocational Training provided research, analysis and recommendations specific to the vocational rehabilitation and assistance provided under the Department's Rehabilitation Program.
The third part of the publication series, Improving the New Veterans Charter: the Report, presents evidence-based options and recommendations to address shortcomings in the three New Veterans Charter program areas identified and examined in the review paper.
Improving the New Veterans Charter: the Actuarial Analysis acts as a supporting document and forms the fourth part of the publication series. It provides detailed demographic and financial data about the current effects of the financial programs that support Veterans. In particular, it focuses on program areas that directly affect the transition of Veterans to civilian life that were identified as not adequately meeting Veterans’ needs. As such, along with serving as the reference point for the Office of the Veterans Ombudsman’s publications in preparation for the parliamentary review, the actuarial analysis and its modelling capacity can be used to verify the accuracy of financial assumptions pertaining to the parliamentary review process.
Actuarial Analysis Overview
Background
Historically, disability benefits were provided to Veterans as a lifetime monthly pension under the Pension Act. In 2006, the Government of Canada enacted the New Veterans Charter to offer, in lieu of a monthly pension cheque, a suite of benefits and services that encourages wellness and rehabilitation and is consistent with the principles of modern disability management. Under the new legislation, the way disability benefits are paid has significantly changed. Particularly, one of the benefits Veterans now receive is a lump sum amountFootnote 3 paid in recognition of pain and suffering, physical and/or psychological loss, functional impairment and the impact on the member's or the Veteran's overall quality of life and the impact on the lives of the member's or the Veteran's family.Footnote 4
This change has created controversy in the Veterans’ community for a number of reasons. One of the main concerns has been the belief that the New Veterans Charter disability benefits are inferior to those provided under the Pension Act. Many Veterans have justified this conclusion based on calculations they have done to compare disability award amounts with estimates of what they believed would have been provided if they had received a monthly pension instead. As a result, some Veterans believe that the New Veterans Charter should be completely eliminated.
The Veterans Ombudsman recognized early on that such unstructured, individual analysis did not fully take into consideration the complete suite of benefits contained in the New Veterans Charter disability benefit programs. Nor were any comparative calculations being done that recognized the full depth, breadth and complexity of both pension accounting and the related principles implicit in each of the acts.
The complexity of Veterans programs and their interrelationships are such that one has to be careful about making direct comparisons between the Pension Act and the New Veterans Charter. Like items need to be compared with like items. For example, benefits for meeting economic needs should not be compared to benefits provided for compensation for pain and suffering. In addition, other government benefits, such as Canadian Forces Superannuation and Canada Pension Plan payments, must be considered, as they are complementary benefits provided by the government that help achieve a desired whole-of-governmentFootnote 5 financial effect.
Therefore, in 2009, to better inform Veterans and to gain insight into the differences in these disability benefits, the Veterans Ombudsman commissioned an independent expert and international leader in the field of actuarial analysis, Aon Hewitt,Footnote 6 to construct an actuarial model capable of performing a credible comparison of the like benefits provided under the New Veterans Charter and the Pension Act.
The first version of this model was completed in December 2009 and has since undergone two revisions. The first revision was adjusted to reflect the Enhanced New Veterans Charter, incorporating changes that were brought about by the passage of Bill C-55, and was completed in October 2011. The second revision, completed in October 2012, incorporated changes brought about by the Federal Court ruling that eliminated the offset of Pension Act disability benefits from the Canadian Forces Service Income Security Insurance Plan ( SISIP ) income replacement benefit.Footnote 7 This analysis presents the financial effects of the current New Veterans Charter financial programs using actuarial science methodology. It focuses on identifying which Veterans are at financial risk and where the potential gaps exist in meeting their financial needs. By examining the practical aspects of what is necessary for a Veteran’s financial security, it guides the discussion away from subjective and emotional aspects of what is deemed fair compensation for pain and suffering.
It should be noted that in 2011, Queen’s University published a study called Supporting Canadian Veterans with Disabilities,Footnote 8 which provided the first academic comparative analysis of the benefits provided under the Pension Act and the New Veterans Charter. However, this study was published prior to recent enhancements to the New Veterans Charter and the Federal Court ruling.
Why Conduct an Actuarial Analysis?
Knowing the cost of pension benefits is of fundamental importance to the viability of a plan or program. Actuarial science provides estimates of these amounts for pension plans. Actuaries perform extensive analysis on future probabilities that include human factors such as mortality rates and life expectancy, and financial factors such as inflation rates and trends in the investment markets.
One output of this analysis is mortality tables showing probable life expectancies of different segments of the population, which help predict how long a pensioner will continue to receive benefits. Another output is financial tables, which help predict how invested money will grow on the one hand, but be eroded by inflation on the other. Analyzing these tables in combination predicts the required funding to satisfy pension needs at different points over the plan’s lifetime.
The analysis conducted by Aon Hewitt considered scenarios in which a Veteran might receive benefits under the New Veterans Charter. Using actuarial tables, each scenario then compared these benefits against those that the Veteran would have received under the Pension Act. The actuarial tables provided estimates on how long Veterans in each pension scenario would receive benefits and adjusted the total amount to reflect present day values. This was then compared to the amount the Veteran would receive under the New Veterans Charter with the result expressed as a percentage.
This type of analysis is called modelling. Its main objective is to compare whether sums provided equate to a similar payout schedule using comparable human and investment factors. The simplest way to begin such a comparison is to structure a typical payout table for different scenarios. Comparing the funds required to the amount awarded then allows an assessment to be made. To do so, however, the funds required over the lifetime of a pensionable scenario must be valued in one amount, in the present.
Appendix A provides a summary of the actuarial accounting principles used in this review.
Comparing the Benefits Provided Under the Pension Act and the New Veterans Charter
Veterans Affairs Canada maintains that the main difference between the Pension Act and the New Veterans Charter is that the Charter is focused on wellness and rehabilitation, while the Pension Act focuses on compensation. The main practical difference between disability benefits provided under the Pension Act and the New Veterans Charter is that benefits under the Charter are mostly provided as benefits that compensate for lost earnings (or capacity to earn) and are taxable, whereas benefits provided under the Pension Act compensate mostly for pain and suffering and are not taxable.
The distinction between economic and non-economic benefits is clear within the New Veterans Charter, but is not defined within the Pension Act. In fact, the New Veterans Charter categorizes benefits as either economic or non-economic. The former are paid with “the objective of compensating for the earnings lost due to injury or illness resulting primarily from service.”Footnote 9 The latter are paid “in recognition of pain and suffering, physical and/or psychological loss, functional impairment and impact on the veteran's or the Veteran's overall quality of life and the impact on the lives of the member's or the Veteran's family.”Footnote 10 With this categorization in mind, the goal of any compensation analysis should be to determine whether economic needs are being met first and then examine whether the compensation for pain and suffering is adequate.
Of particular note, the New Veterans Charter pays out compensation for pain and suffering in a lump sumFootnote 11 while the Pension Act provides a monthly pension for life.
Impact of the Federal Court Decision on the SISIP Practice of Offsetting the Pension Act Disability Pension
The Federal Court decisionFootnote 12 that eliminated the practice of offsetting the Pension Act Disability Pension from the SISIP Long Term Disability Plan income replacement benefit has had a significant effect on the comparisons being made between the Pension Act and the New Veterans Charter for those Veterans who are receiving a Disability Pension and received SISIP Long Term Disability income replacement or VAC Earnings Loss Benefit payments from 1976 to the present.Footnote 13
The Court ruled on the legality of the SISIP policy of reducing long-term disability benefits payable to disabled Canadian Forces veterans by the monthly disability pension amounts payable to those members under the Pension Act. Central to the dispute was the interpretation of whether monthly benefits payable to disabled Canadian Forces members under the Pension Act are “monthly income benefits” as that phrase is used in the SISIP policy. The judge ruled in favour of Veterans, stating: “The SISIP offset effectively defeats the Parliamentary intent that is inherent in the Pension Act which is to provide modest financial solace to disabled CF veterans for their non-financial losses."Footnote 14
The federal government did not appeal the decision and, although the decision only affected the Canadian Forces SISIP Long Term Disability plan, the Minister of Veterans Affairs recognized the need for Veterans Affairs Canada’s programs to follow suit by stating: “Our Government is taking action by going above and beyond the Federal Court ruling. We will harmonize our disability benefits at Veterans Affairs to reflect the planned changes to Service Income Security Insurance Plan.”Footnote 15
Benefits Compared by Aon Hewitt
Figure 1. Benefits compared in the Aon Hewitt analysis
| Pension Act | Pension Act with Court Decision | Enhanced New Veterans Charter |
|---|---|---|
|
Service Income Security Insurance Plan ( SISIP ) Long Term Disability Plan [1]
|
Earnings Loss Benefit [1]
|
Disability Pension [1]
|
Disability Pension [1]
|
Disability and Death Benefit [1]
|
Supplementary Retirement Benefit [1]
|
||
| Prisoners of War [2] | Prisoners of War [2] | Detention Benefit [2] |
| Exceptional Incapacity Allowance [1] | Exceptional Incapacity Allowance [1] | Permanent Impairment Allowance [1] |
| War Veterans Allowance [3] | War Veterans Allowance [3] | Canadian Forces Income Support [2] |
| Attendance Allowance [1] | Attendance Allowance [1] | Permanent Impairment Allowance Supplement [1] |
[1] Benefits that were analyzed within the model.
[2] Benefits that were not analyzed within the model.
[3] Benefits that were not analyzed, as they are not awarded to Canadian Forces veterans.
The treatment benefits that are provided identically under both acts were not considered. For example, clothing allowances have the same dollar value and eligibility criteria under both acts, so they were not compared. Eligibility and payment values for the Veterans Independence Program remain the same under both acts, so this program was also not considered as part of the analysis.
Actuarial and Statistical Results
Financial Comparison of the New Veterans Charter to the Pension Act
Considering that financial benefits are provided under these two different legislative regimes, it is not surprising that recipients compare the value of New Veterans Charter benefits to the value of Pension Act benefits. Frequently, comparisons are made only between the Pension Act monthly Disability Pension and the New Veterans Charter lump sum Disability Award without taking into context the overall suite of monetary and non‑monetary benefits provided under the New Veterans Charter. Such "cherry picking" does not provide an objective view of how all the benefits come together to provide a particular effect.
In general terms, the desired outcomes of benefits provided to injured or ill VeteransFootnote 16 should be access to health care, financial security and self-fulfillment.
The three areas of focus (financial, vocational rehabilitation and assistance,Footnote 17 and family support) addressed in Improving the New Veterans Charter: the Parliamentary Review play important roles in Veterans successfully achieving these desired outcomes.
Veterans also need to be compensated fairly for pain and suffering. In Improving the New Veterans Charter: the Report, the Office of the Veterans Ombudsman makes one recommendation concerning compensation for pain and suffering, but does not elaborate on it. This is because one of the goals of this publication series is to address the financial shortcomings in meeting Veterans' economic needs. Therefore, it is centred on the understanding that only after the financial needs of Veterans are met can an informed debate on compensation for pain and suffering occur.
The purpose of comparisons between the Pension Act and the New Veterans Charter in this analysis is to provide a benchmark that can be used as a catalyst for informed discussion on meeting Veterans’ financial security needs. The goal is not to achieve financial parity between the two acts. Instead, the goal is to highlight where there may be gaps to achieving the desired outcomes noted above.
Aon Hewitt Study Results
The firm Aon Hewitt was contracted to provide a comparison of the overall dollar values of the benefits provided under the New Veterans Charter and the Pension Act. The contract did not require Aon Hewitt to differentiate between economic and non-economic benefits. Accordingly, the results of the study, stated below, reflect their analysis of the overall values of the combined effects of both economic and non-economic benefits.
The study identified that the New Veterans Charter produces lower overall actuarial present values than the Pension Act for the following groups, in particular:
- Veterans with low pre-release salary;
- Veterans with a family;
- Older Veterans, at the time of first payment (except for ages above 70 in some instances);
- Veterans with higher disability levels; and,
- Female Veterans.Footnote 18
Aon Hewitt also concluded that the present actuarial value of benefits under the Enhanced New Veterans Charter was equivalent or higher, when compared to the benefits under the Pension Act, for the following situations:
- Regular Force Veterans with pre-release salaries below $53,700, aged 50 and under, and with disability levels below 50 percent. When compared to the Pension Act and taking into account the Federal Court decision, this applies only to single Veterans with salaries of more than $30,000 or with disability levels less than 20 percent.
- In some instances when Veterans are eligible to receive the Permanent Impairment Allowance Supplement.
- For widows and orphans (e.g., when a death award is payable), the Enhanced New Veterans Charter benefits are higher than under the Pension Act. The court decision had no effect on death benefits.
In the majority of other cases, the overall actuarial present value of benefits paid under the Enhanced New Veterans Charter is below the actuarial present value of the benefits paid under the Pension Act, with or without taking into account the Federal Court decision. For most scenarios modelled by Aon Hewitt, a greater difference in benefits exists because of the Federal Court decision.
Although the study highlights the financial disparities between the New Veterans Charter and the Pension Act, it also clearly demonstrates that the amendments made to the New Veterans Charter in October 2011 had a positive effect (by eliminating Veterans with low pre-release salary as a group that is financially disadvantaged when the New Veterans Charter is compared to the Pension Act).
The study produced evidence that there are significant gaps in the economic benefits being provided to some groups of Veterans. It also became evident to the Office of the Veterans Ombudsman that resolving that disparity first would then help to focus the discussion on what fair compensation for the non-economic benefits would be. The analysis also indicated to the Office that a clear understanding of who is at financial risk and why they are at risk is required before determining solutions.
Office of the Veterans Ombudsman’s Analysis
Demographic ConsiderationsFootnote 19
The most significant factor that affects one’s financial security is the ability to work and generate future wealth. Accordingly, the Office of the Veterans Ombudsman determined pertinent Veterans’ demographics and then correlated these with the specific information on Veterans Affairs Canada’s clients to determine which Veterans’ cohorts are most at financial risk and the likelihood of those scenarios occurring. The at-risk Veterans’ cohort is a subset of Veterans Affairs Canada’s statistics of Canadian Forces Veterans who are totally and permanently incapacitated.Footnote 20 Since the New Veterans Charter can only be accessed by Canadian Forces members, Veterans and their spouses, for the purpose of this analysis and Improving the New Veterans Charter: the Report, the demographics analyzed are for Canadian Forces Veterans only. The following summarizes the major demographics of the Veterans population and Veterans Affairs Canada clients:Footnote 21
Figure 2. Veterans Demographics
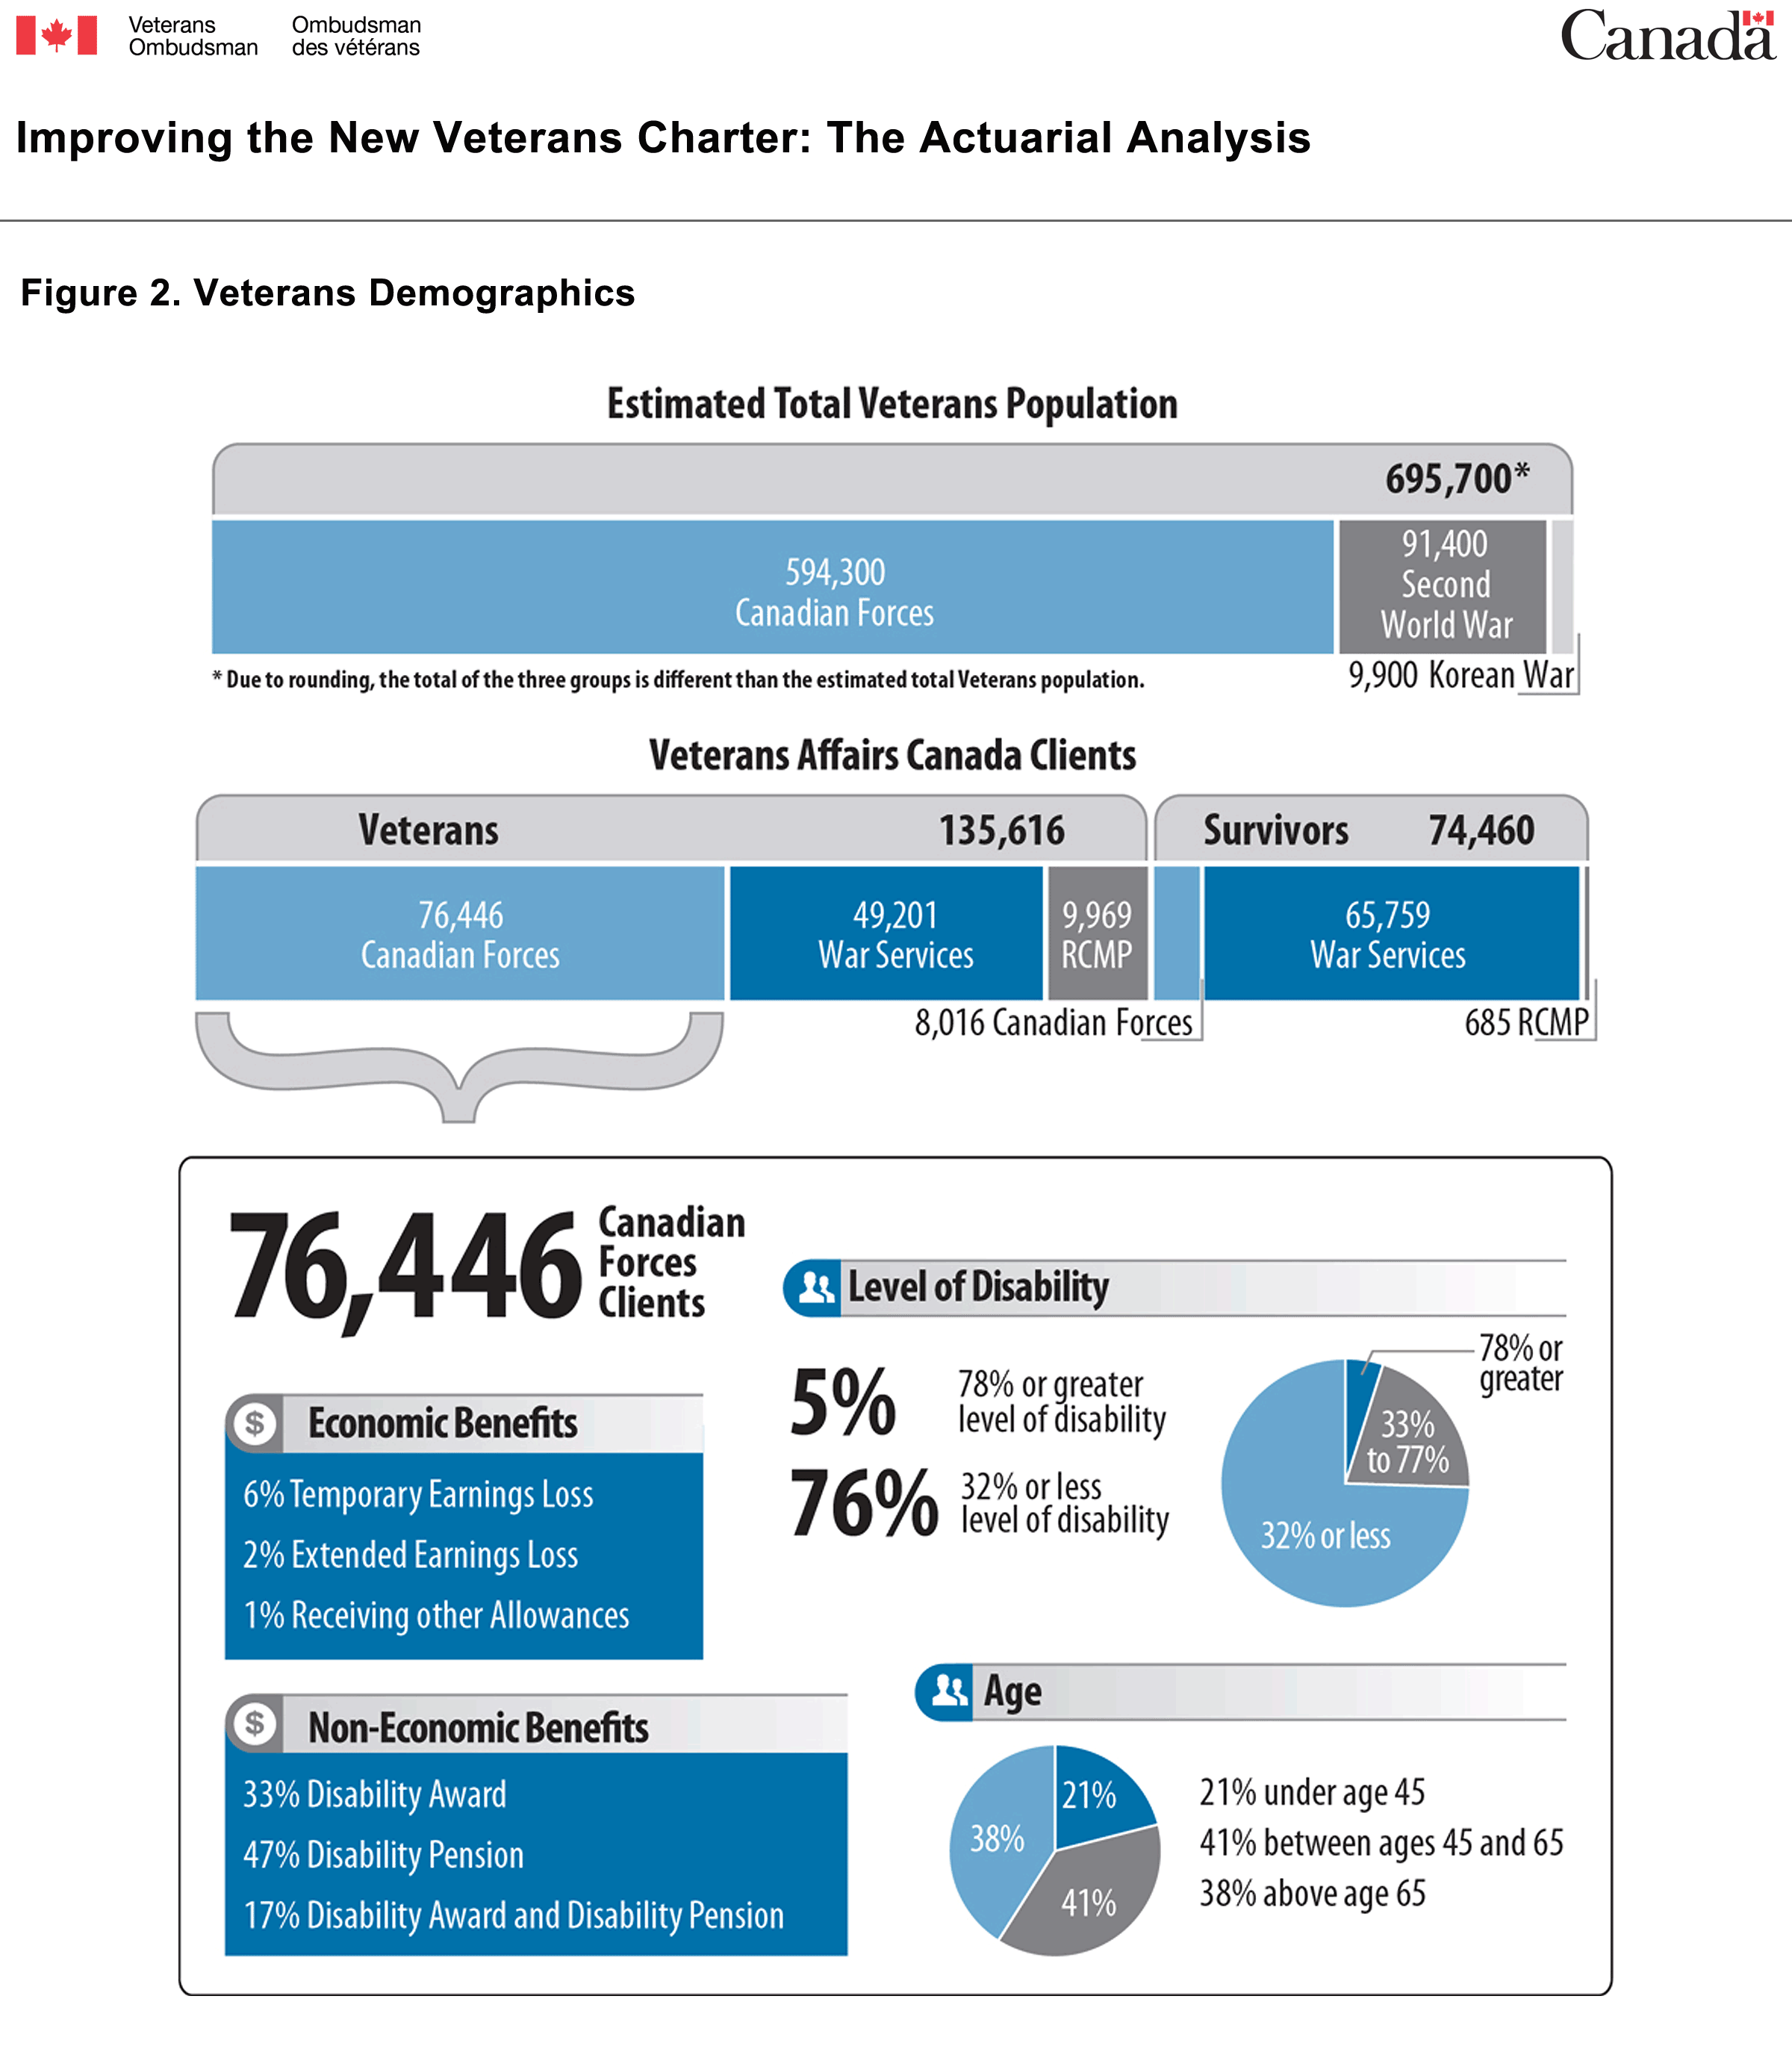
Estimated Total Population of Veterans
The estimated total Veterans population is 695,700* and is made up of these groups:
- Canadian Forces – 594,300
- Second World War – 91,400
- Korean War – 9,900
* Due to rounding, the total of the three groups is different than the estimated total Veterans population.
Total Clients of Veterans Affairs CanadaClients of Veterans Affairs Canada are divided into two main categories: Veterans and survivors. Each of these categories includes clients from these groups: Canadian Forces, war services and RCMP.
The breakdown for Veteran clients of Veterans Affairs Canada is as follows:
- Canadian Forces – 76,446
- War services – 49,201
- RCMP – 9,969
- Total – 135,616
The breakdown for survivor clients of Veterans Affairs Canada is as follows:
- Canadian Forces – 8,016
- War services – 65,759
- RCMP – 685
- Total – 74,460
Economic Benefits of the 76,446 Canadian Forces Veteran clients:
- 6 percent receive temporary earnings loss
- 2 percent receive extended earnings loss
- 1 percent receive other allowances
Non-Economic Benefits of the 76,446 Canadian Forces Veteran clients:
- 33 percent receive Disability Award
- 47 percent receive Disability Pension
- 17 percent receive Disability Award and Disability Pension
Level of Disability of the 76,446 Canadian Forces Veteran clients:
- 5 percent have a 78 percent or greater level of disability
- 76 percent have a 32 percent or less level of disability
- 19 percent have a level of disability ranging from 33 to 77 percent
The ages of the 76,446 Canadian Forces Veteran clients:
- 21 percent are under the age of 45
- 41 percent are between the ages of 45 and 65
- 38 percent are above the age of 65
These statistics indicate that most Canadian Forces Veterans who are Veterans Affairs Canada clients are at a disability level that indicates that they likely have minimal barriers to transitioning from the military to civilian life.
Figure 3. Veterans Affairs Canada Clients from the Canadian Forces
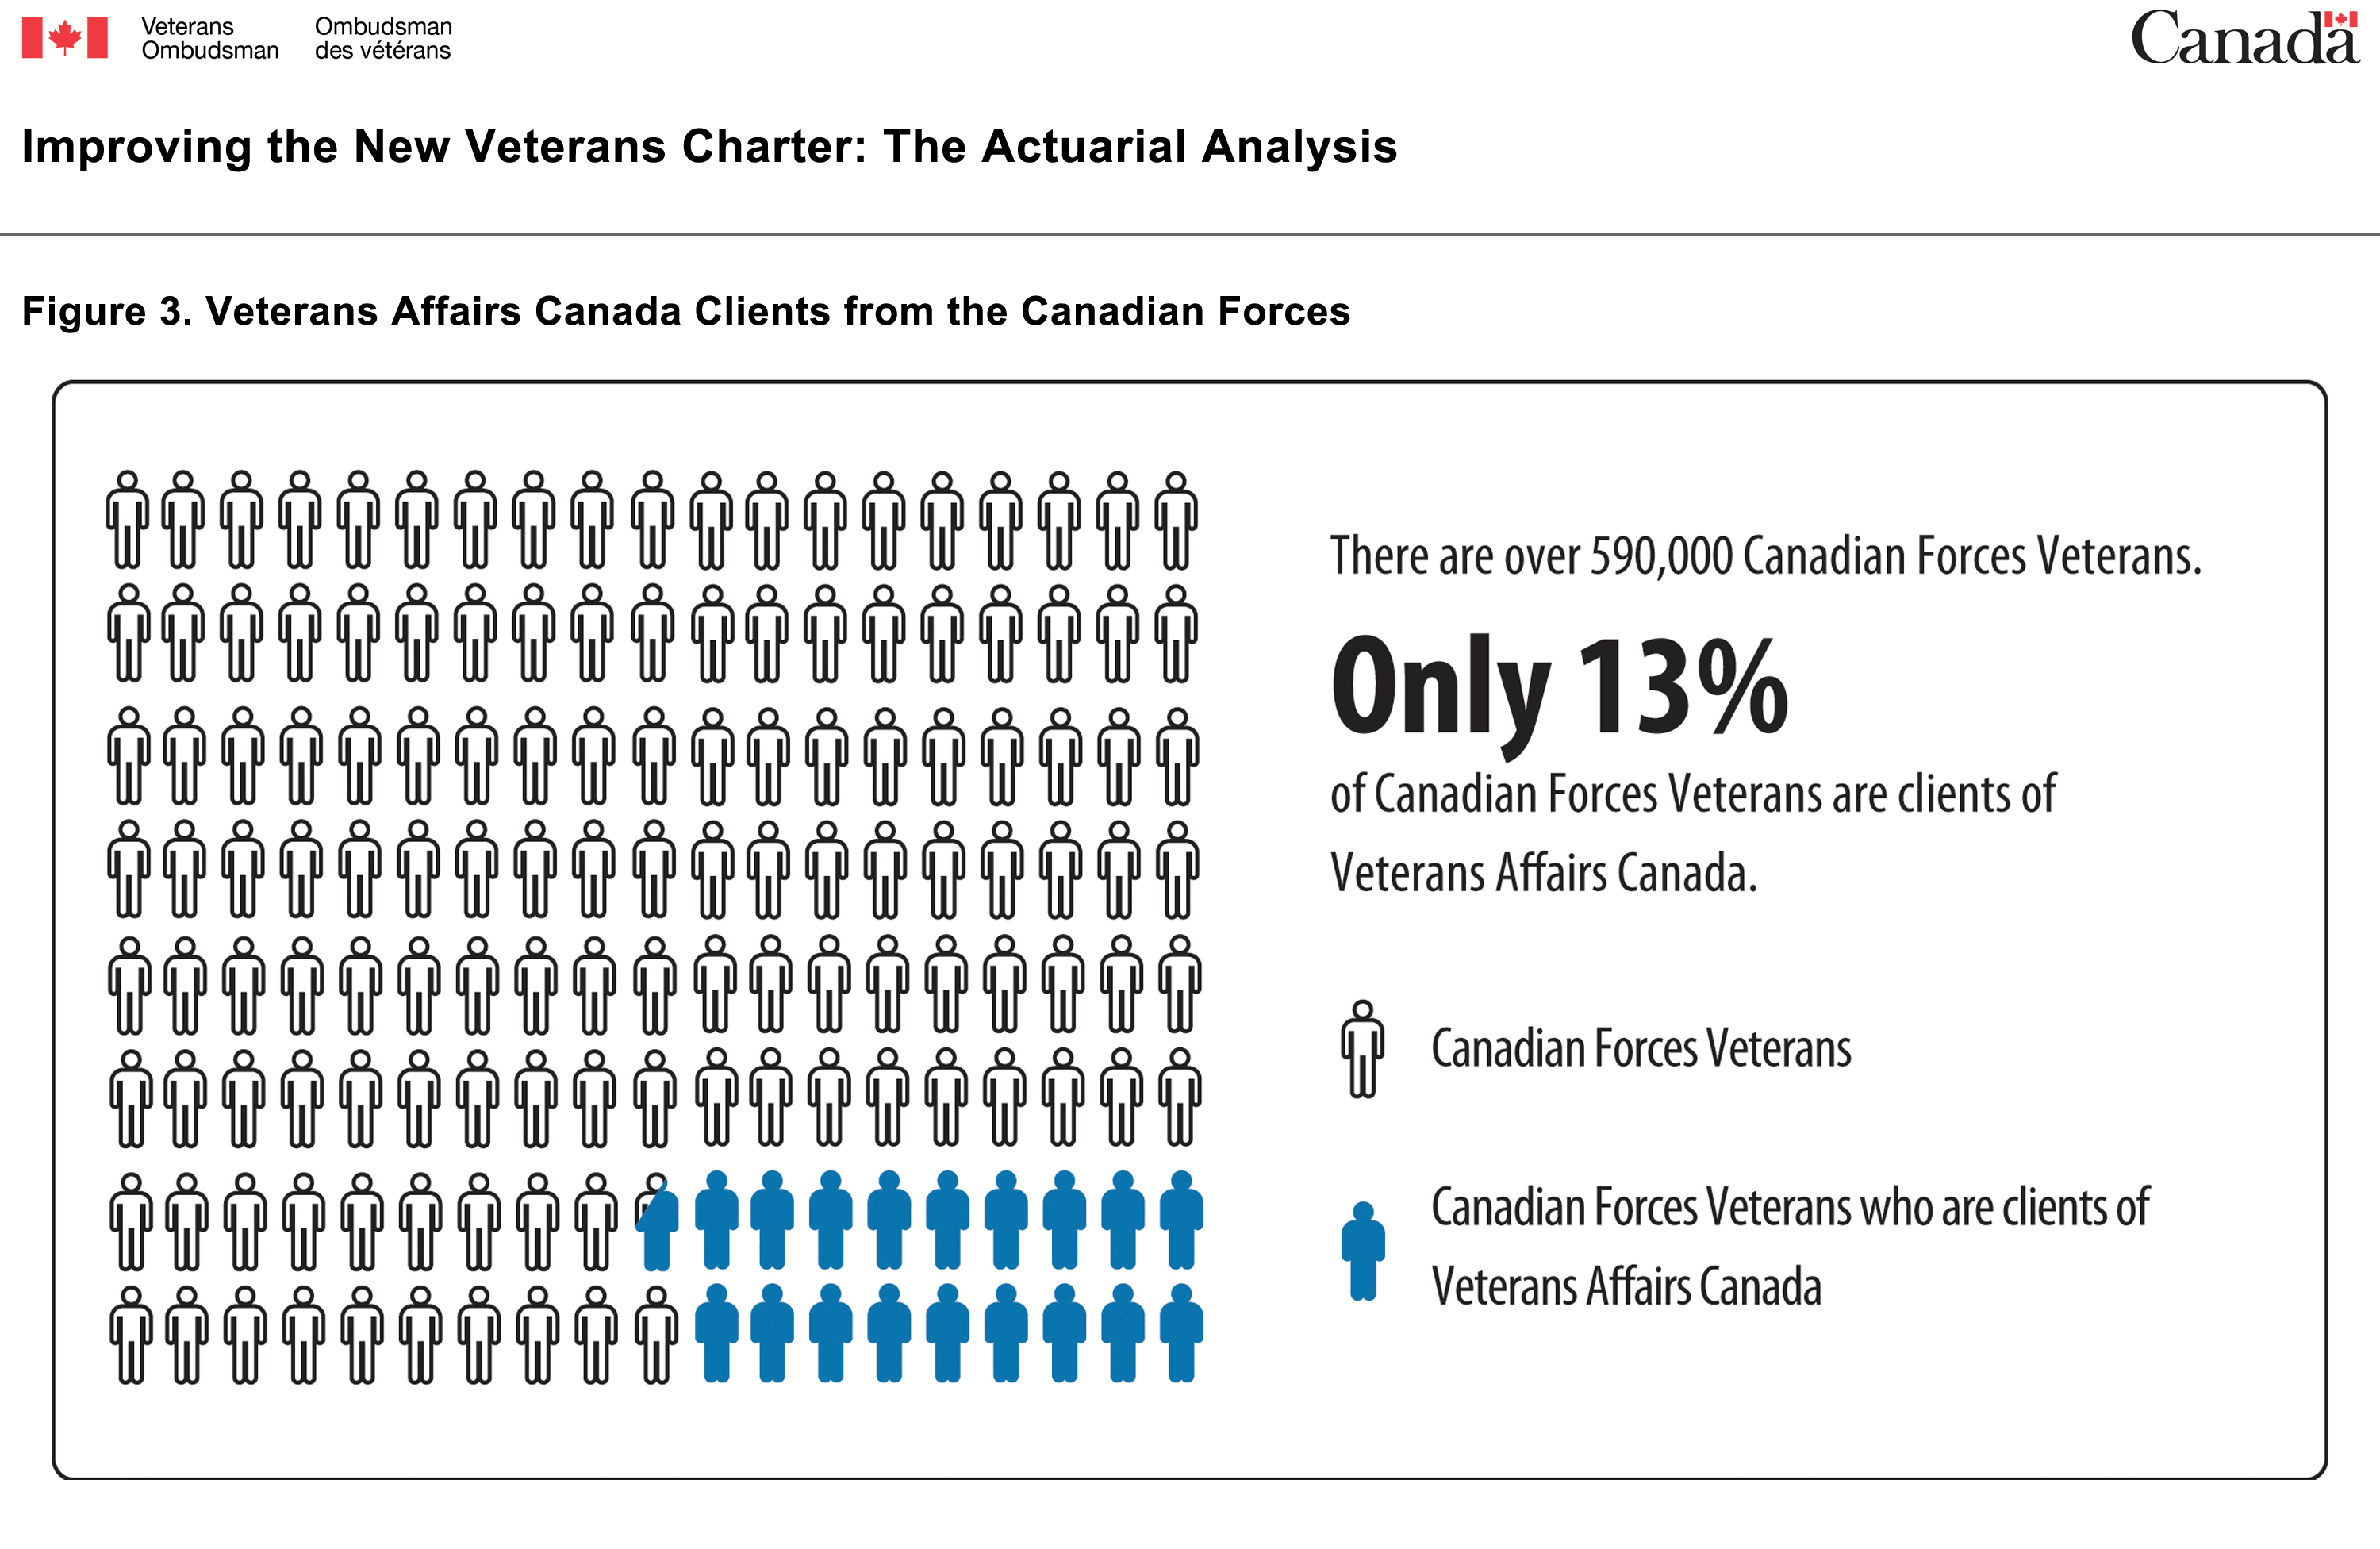
- There are over 590,000 Canadian Forces Veterans.
- Only 13 percent of Canadian Forces Veterans are clients of Veterans Affairs Canada.
Another point to note is that Canadian Forces Veterans who are Veterans Affairs Canada clients only represent 15 percent of the total estimated population of Canadian Forces Veterans, and little is known about the potential needs of the larger population.
Determining Who is at Financial RiskTop of Page
Finding one statistic within Veterans Affairs Canada’s database that can be used as a benchmark to determine who is the most at financial risk is challenging. Using the disability level as a benchmark is attractive as it is easily understood and intuitively leads one to consider that the higher the disability level, the higher the needs one is likely to have and the lower the opportunity one has to generate income. However, the Veterans at higher disability levels tend to have better access to the various allowances, which mitigates the economic impact of their disability. As well, disability levels alone provide no insight into the impact those disabilities have on the Veteran. Veterans can have a high disability assessment level comprised of many minor ailments that are not having a significant impact on their ability to transition to civilian life. Conversely, Veterans may have a low disability assessment level, but their condition is so debilitating that the Veteran cannot successfully make the transition to civilian life.
After consideration, the statistical benchmark that appears to provide the greatest indicator of risk is the category of totally and permanently incapacitated Veterans. A totally and permanently incapacitated designation indicates that a Veteran’s disabilities are creating permanent barriers to transition, such that the Veteran cannot work or cannot work at the income level he or she once had. This designation is based on an overall assessment of the Veteran's current situation and is not dependent on indicators such as disability level, disability condition or demographic indicators, such as age or family status. As a result, the totally and permanently incapacitated designation provides the first clear indicator that there is a significant barrier to transition that is affecting Veterans’ ability to provide for themselves.
Figure 4. Demographics of Totally and Permanently Incapacitated Veterans
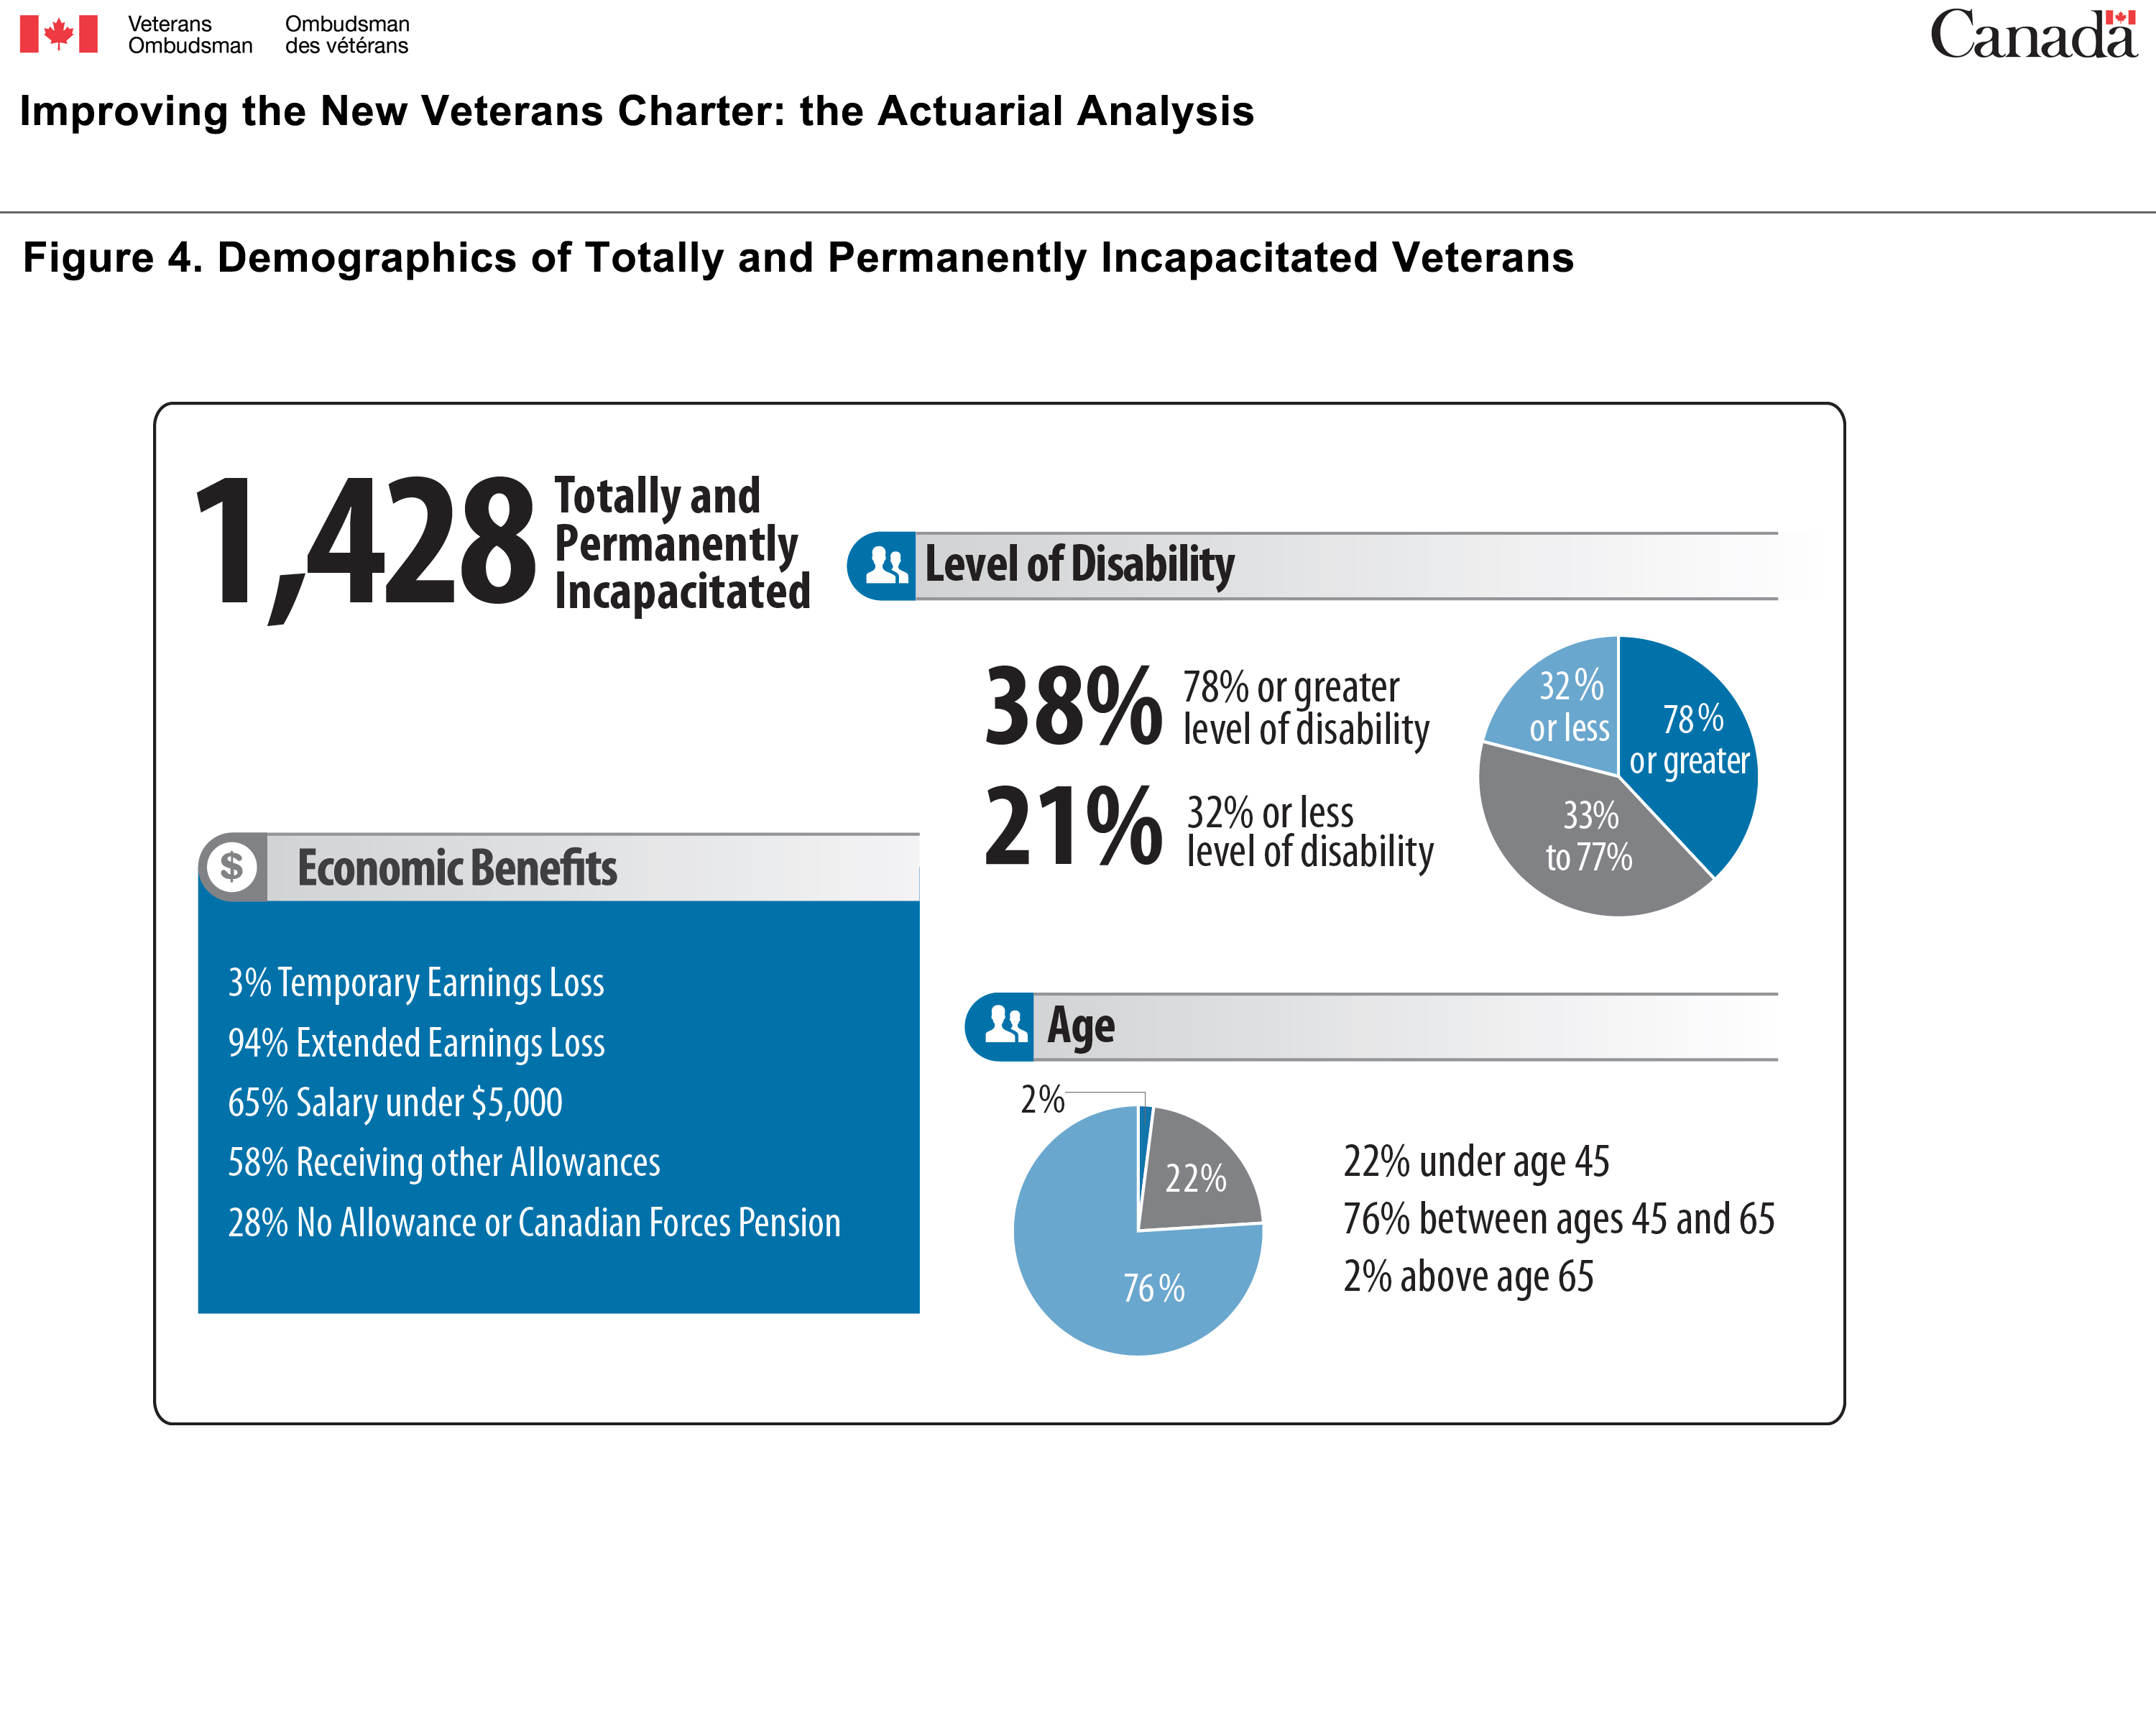
There are 1,428 totally and permanently incapacitated Veterans.
Economic Benefits of the 1,428 totally and permanently incapacitated Veterans:
- 3 percent receive temporary earnings loss
- 94 percent receive extended earnings loss
- 65 percent receive a salary under 5,000 dollars
- 58 percent receive other allowances
- 28 percent receive no allowance or Canadian Forces pension
Levels of disability of the 1,428 totally and permanently incapacitated Veterans:
- 38 percent have a 78 percent or greater level of disability
- 21 percent have a 32 percent or less level of disability
- 41 percent have a level of disability ranging from 33 to 77 percent
The ages of the 1,428 totally and permanently incapacitated Veterans:
- 22 percent are under the age of 45
- 76 percent are between the ages of 45 and 65
- 2 percent are above the age of 65
Not everyone within the group of 1,428 totally and permanently incapacitated Veterans is at financial risk. Some Veterans are eligible for the complete suite of benefits available and are receiving allowances and/or Canadian Forces Superannuation payments that mitigate the effects of the economic barriers caused by their disabilities.Footnote 22 It is to be noted as well that some Veterans may have minimal medical barriers to transition but have received a totally and permanently incapacitated designation because they cannot work at a level that will provide 66⅔ percent of their pre-release salary.
The following figure breaks down the totally and permanently incapacitated Veterans into those who are receiving allowances and those who are not. Since totally and permanently incapacitated Veterans are receiving the Extended Earnings Loss Benefit until age 65, knowing which Veterans are not receiving allowances or superannuation payments will indicate who may be at financial risk when the Extended Earnings Loss Benefit ceases. The Permanent Impairment Allowance is the allowance that has the greatest impact, as any Veteran who is eligible for it automatically becomes eligible for the Permanent Impairment Supplement because of their totally and permanently incapacitated designation.Footnote 23 By looking first at who is not receiving the Permanent Impairment Allowance, the Office of the Veterans Ombudsman determined that 406 totally and permanently incapacitated Veterans are not receiving any allowances or Canadian Forces Superannuation payments.
Figure 5. At Risk Totally and Permanently Incapacitated Veterans
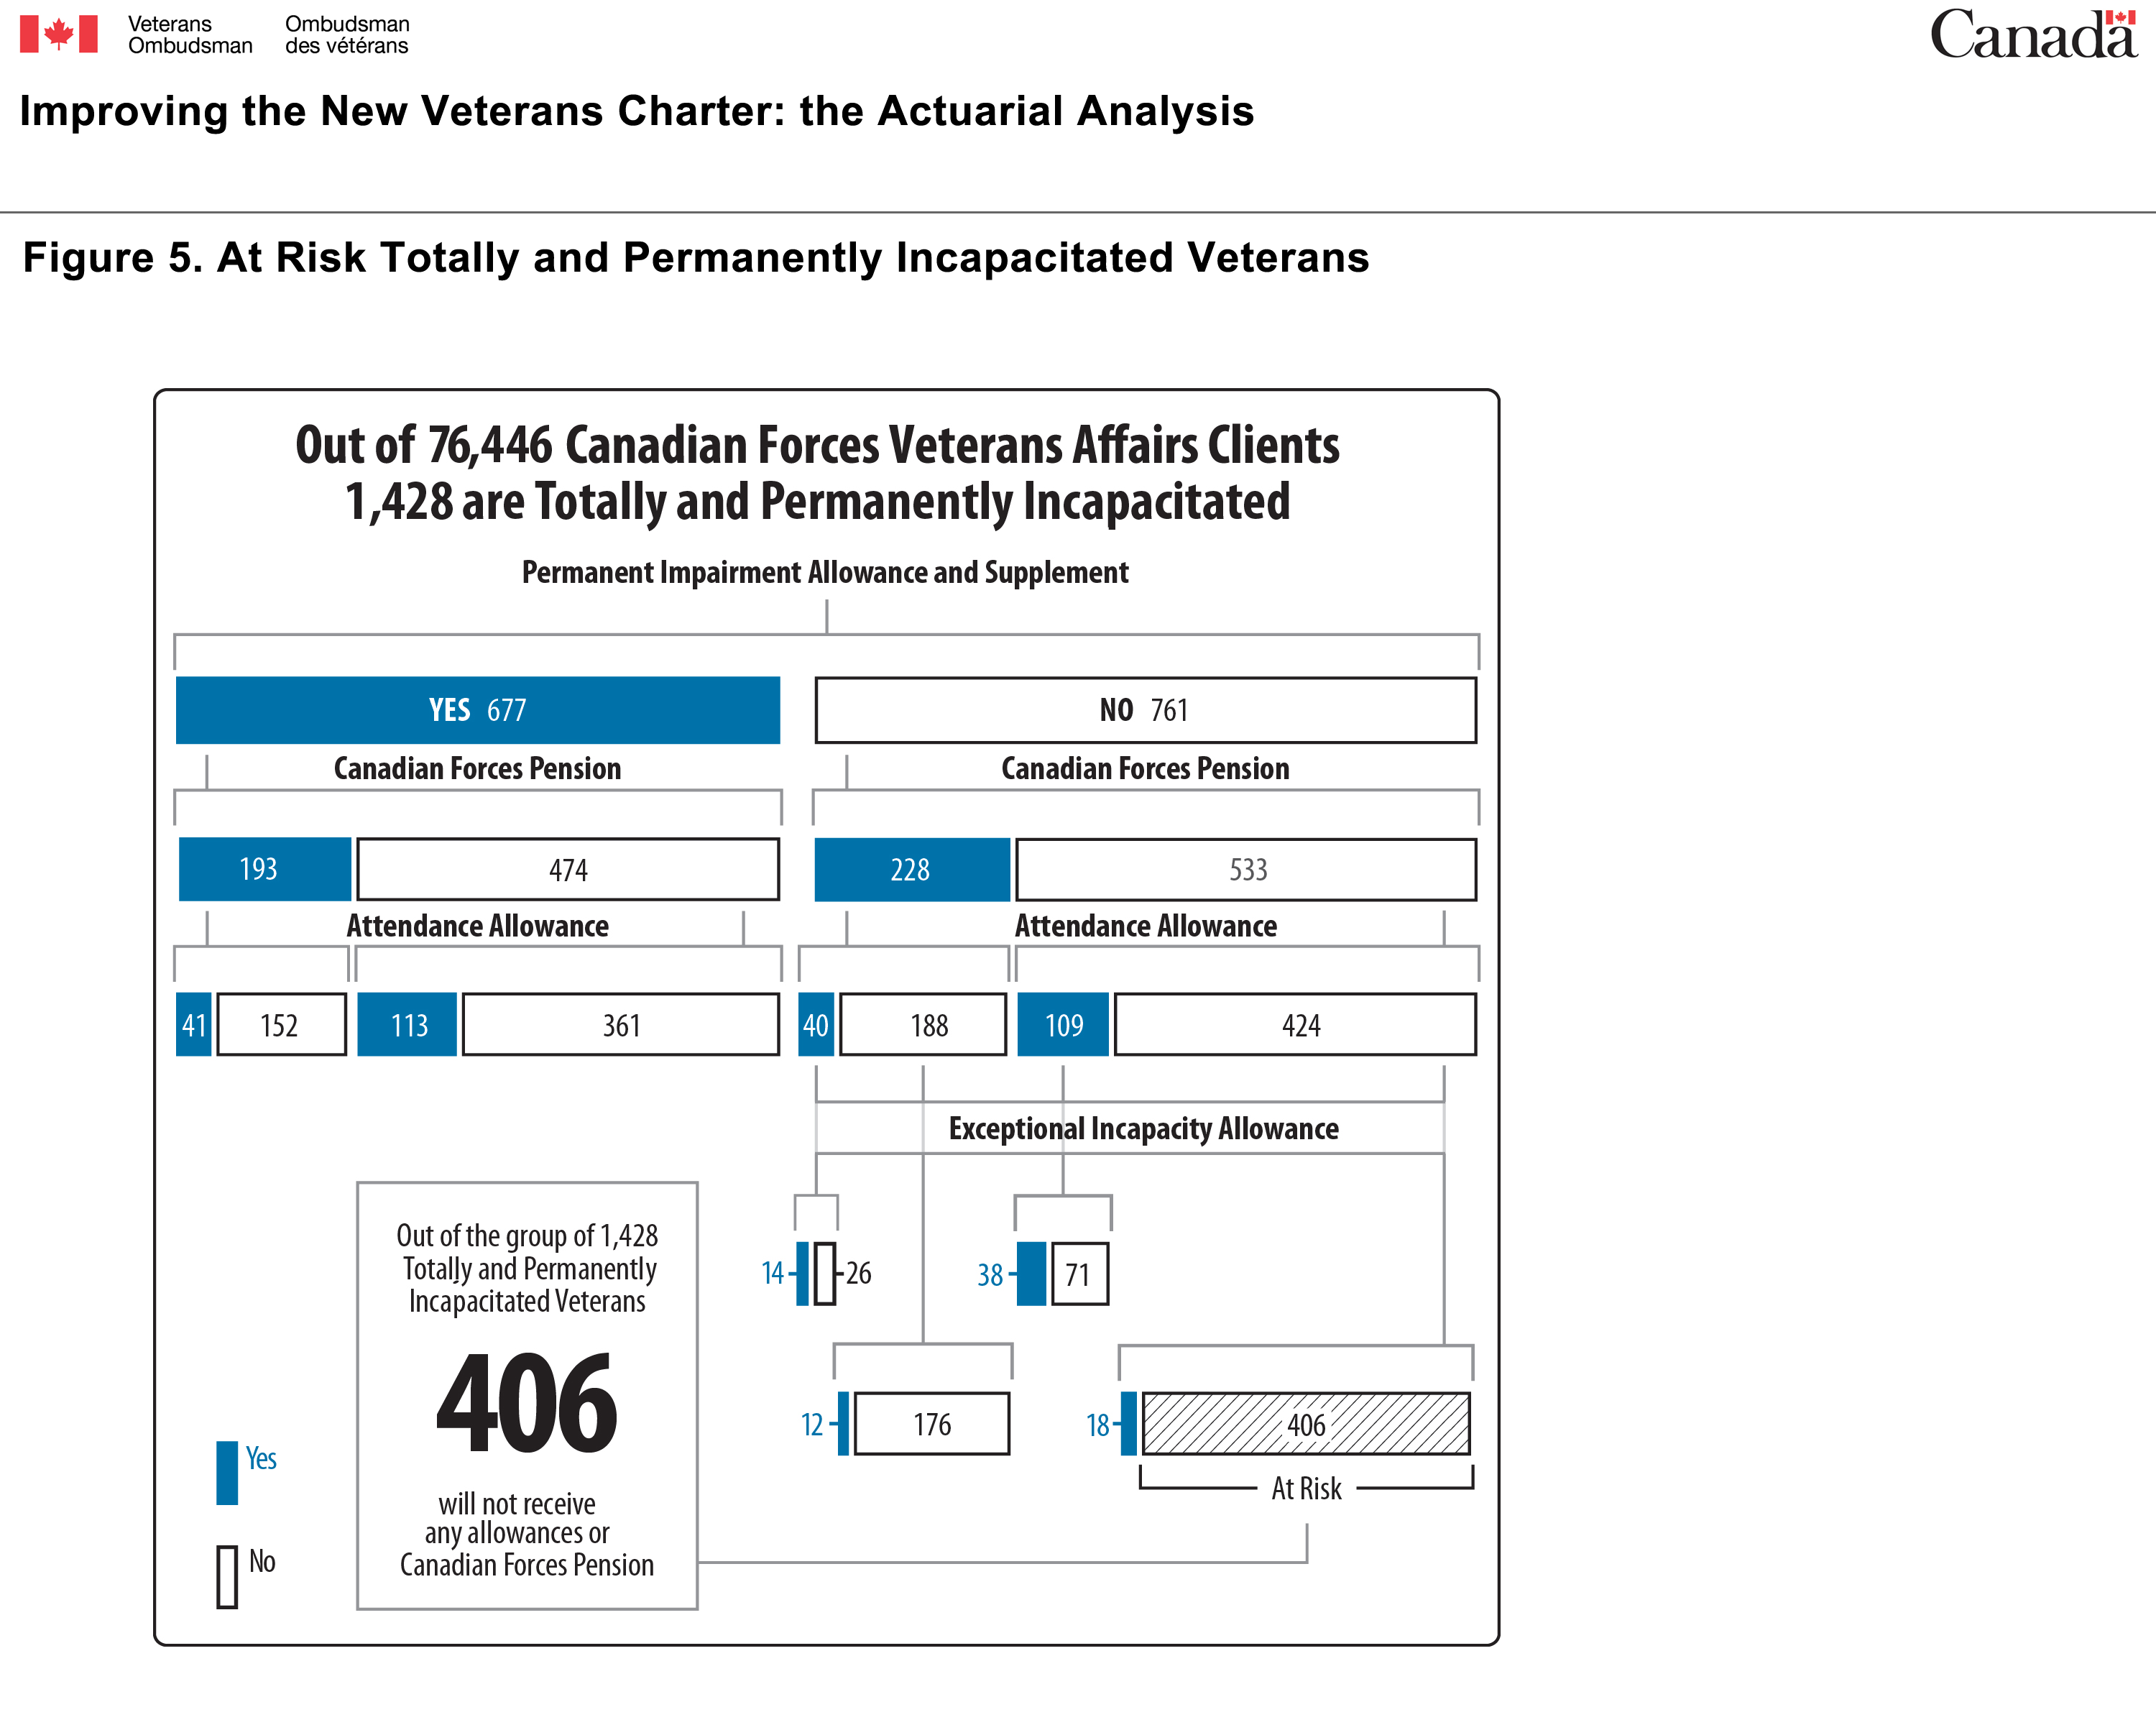
Of the 76,446 Canadian Forces clients of Veterans Affairs Canada, 1,428 are totally and permanently incapacitated.
Refer below for a breakdown of the various allowances and pension the 1,428 totally and permanently incapacitated veterans receive:
- Of the 1,428 - 677 receive the Permanent Impairment Allowance and Supplement
- Of the 677 - 193 receive the Canadian Forces Pension
- Of the 193 - 41 receive the Attendance Allowance
- Of the 193 - 152 do not receive the Attendance Allowance
- Also of the 677 - 474 do not receive the Canadian Forces Pension
- Of the 474 - 113 receive the Attendance Allowance
- Of the 474 - 361 do not receive the Attendance Allowance
- Of the 677 - 193 receive the Canadian Forces Pension
- Of the 1,428 - 761 do not receive the Permanent Impairment Allowance and Supplement
- Of the 761 - 228 receive the Canadian Forces Pension
- Of the 228 - 40 receive the Attendance Allowance
- Of the 40 - 14 receive the Exceptional Incapacity Allowance
- Of the 40 - 26 do not receive the Exceptional Incapacity Allowance
- Of the 228 - 188 do not receive the Attendance Allowance
- Of the 188 - 12 receive the Exceptional Incapacity Allowance
- Of the 188 - 176 do not receive the Exceptional Incapacity Allowance
- Of the 228 - 40 receive the Attendance Allowance
- Also of the 761 - 533 do not receive the Canadian Forces Pension
- Of the 533 - 109 receive the Attendance Allowance
- Of the 109 - 38 receive the Exceptional Incapacity Allowance
- Of the 109 - 71 do not receive the Exceptional Incapacity Allowance
- Of the 533 - 424 do not receive the Attendance Allowance
- Of the 424 - 18 receive the Exceptional Incapacity Allowance
- Of the 424 - 406 do not receive the Exceptional Incapacity Allowance
- Of the 533 - 109 receive the Attendance Allowance
- Of the 761 - 228 receive the Canadian Forces Pension
Of the 1,428 totally and permanently incapacitated Veterans, 406 do not receive any allowances or Canadian Forces pension and are most at risk.
It is this group of 406 VeteransFootnote 24 that appears to be most at financial risk. It should also be noted that some Veterans that are receiving allowances at the lower rates and/or a minimal Canadian Forces Superannuation payment might also be at risk, depending on their circumstances. The analysis shows that potentially one third of those Veterans designated as totally and permanently incapacitated could be at risk financially after age 65. In addition to these Veterans Affairs Canada clients, some of the estimated 1,500 SISIP clients that have been declared totally disabled have to be considered as potentially at financial risk for the same reason.
Office of the Veterans Ombudsman’s Modelling Results
The Office of the Veterans Ombudsman further developed Aon Hewitt’s actuarial toolFootnote 25 to conduct an analysis that would determine the following:
- The current financial effects of existing programs;
- The dollar values required to improve various benefits; and,
- The effects of proposed recommendations made in Improving the New Veterans Charter: the Report.
One of the limitations of previous analysis has been that none have analyzed how many Veterans are affected by a particular scenario. By further developing the modelling tool developed by Aon Hewitt to provide an overall financial comparison of the New Veterans Charter to the Pension Act financial benefits, the Office was able to understand how many Veterans are impacted by a particular scenario then define, analyze and propose solutions to resolve future financial shortcomings. As well, the tool can be used to break down the various benefits into economic and non-economic categories. Each scenario presented below includes statistical analysis of the demographic that is affected.
Because there are almost as many possible scenarios as there are Veterans, to focus discussion and provide a broad overview of potential areas of concern, scenarios representative of the majority of Veterans classified as totally and permanently incapacitated were developed. There will always be exceptions, but by analysing these broad and representative categories within the Veterans population, realistic conclusions can be made.
To that end, Improving the New Veterans Charter: the Report and The Actuarial Analysis modelled these five general scenarios:Footnote 26
Figure 6. Summary of scenarios
| Scenario | Disability Assessment Level (in percent) | Age | Rank | Years of Service | Salary (in dollars) | Gender |
|---|---|---|---|---|---|---|
| 1 | 80 | 24 | Corporal | 4 | 55,464 | Male |
| 2 | 100 | 47 | Major | 29 | 110,640 | Female |
| 3 | 40 | 30 | Captain | 10 | 81,276 | Male |
| 4 | 95 | 35 | Sergeant | 15 | 63,720 | Male |
| 5 | 50 | 40 | Corporal | 5 | 56,286 | Female |
The scenarios represent the situations of Veterans who cannot work because of their injuries or illnesses. Scenario 5 represents one of the 406 totally and permanently incapacitated Veterans at financial risk.
Scenario 1 – A totally and permanently incapacitated single 24-year-old male Veteran with an assessed disability level of 80 percent, who was medically released from the Canadian Forces at the rank of Corporal (salary of $55,464) with four years of service.
This scenario represents a young Veteran with a high level of disability who has access to the Permanent Impairment Allowance and Supplement, and who has very little pensionable service.
Scenario 2 – A totally and permanently incapacitated 47-year-old female Veteran with an assessed disability level of 100 percent, married with one dependent child, who was medically released from the Canadian Forces at the rank of Major (salary of $110,640) with 29 years of service.
This scenario represents an older Veteran with a very serious disability who has access to the Permanent Impairment Allowance and Supplement, and a high number of years of pensionable service.
Scenario 3 – A totally and permanently incapacitated 30-year-old male Veteran with an assessed disability level of 40 percent, married with one dependent child, who was medically released from the Canadian Forces at the rank of Captain (salary of $81,276) with 10 years of service.
This scenario represents a young Veteran with a moderate level of disability who has access to the Permanent Impairment Allowance and Supplement, a small but immediate unreduced Canadian Forces annuity, and who cannot return to work because of the nature of his disability.
Scenario 4 – A totally and permanently incapacitated 35-year-old male Veteran with an assessed disability level of 95 percent, married with one dependent child, who was medically released from the Canadian Forces at the rank of Sergeant (salary of $63,720) with 15 years of service.
This scenario represents a Veteran with a very high level of disability who has access to the Permanent Impairment Allowance and Supplement, a modest but immediate unreduced Canadian Forces annuity, and who cannot work because of the seriousness of his disability.
Scenario 5 – A totally and permanently incapacitated 40-year-old female Veteran with an assessed disability level of 50 percent, married with one dependent child, who was medically released from the Canadian Forces at the rank of Corporal (salary of $56,286) with five years of service.
This scenario represents a moderately disabled Veteran who joined the Canadian Forces later in life, who is not eligible for the Permanent Impairment Allowance and Supplement, and who has few years of pensionable service.
Individual modelling yielded very precise results as the parameters being inputted were easily obtainable and verifiable.Footnote 27 Individual modelling allows one to see the value of benefits over the lifetime of one particular Veteran. In the example below, values are compared between the different scenarios mentioned earlier.
Figure 7. Actual Present Values of BenefitsFootnote 28
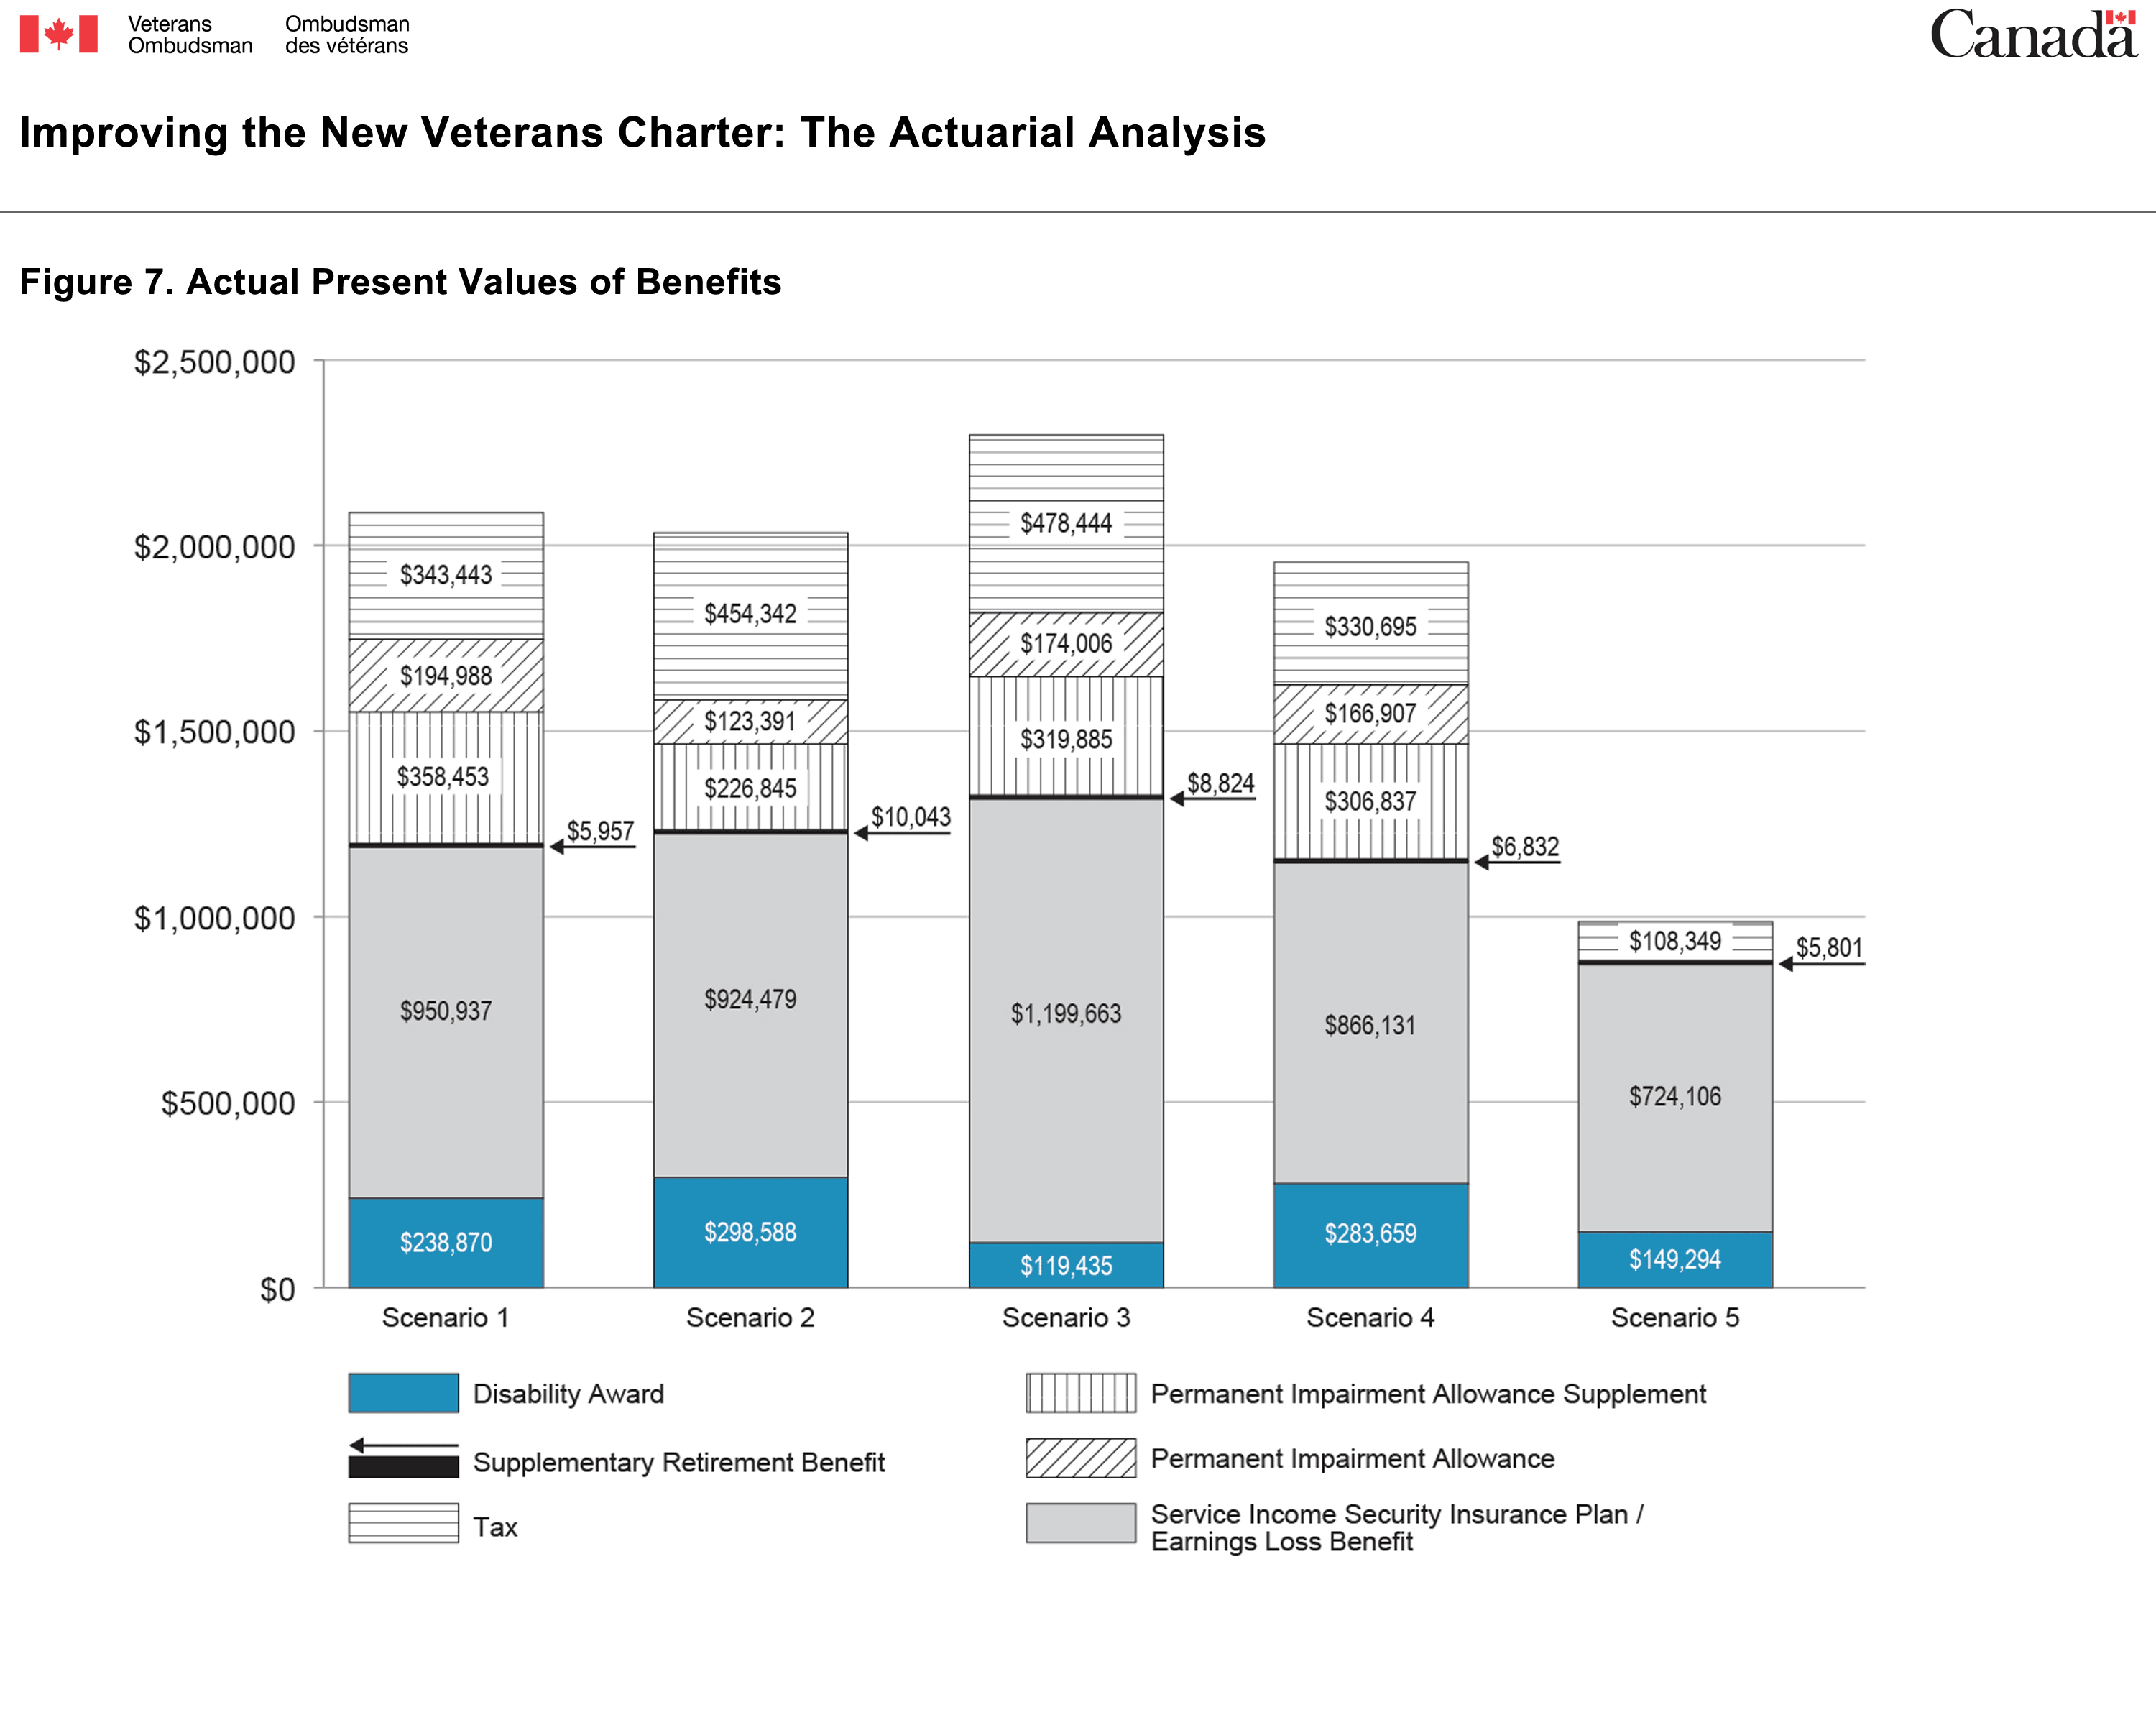
| Category | Scenario 1 (dollars) | Scenario 2 (dollars) | Scenario 3 (dollars) | Scenario 4 (dollars) | Scenario 5 (dollars) |
|---|---|---|---|---|---|
| Tax | 343,443 | 454,342 | 478,444 | 330,695 | 108,349 |
| Permanent Impairment Allowance | 194,988 | 123,391 | 174,006 | 166,907 | 0 |
| Permanent Impairment Allowance Supplement | 358,453 | 226,845 | 319,885 | 306,837 | 0 |
| Supplementary Retirement Benefit | 5,957 | 10,043 | 8,824 | 6,832 | 5,801 |
| Earnings Loss Benefit | 950,937 | 924,479 | 1,199,663 | 866,131 | 724,106 |
| Disability Award | 238,870 | 298,588 | 119,435 | 283,659 | 149,294 |
Although the above figure shows the overall effect of the various benefits over the lifetime of the Veteran, it does not break down the benefits into economic and non‑economic categories. By combining both categories of benefits, it is difficult to discern whether financial security is being achieved for the Veteran and if the Veteran has been fairly compensated for pain and suffering. To provide that insight, the Office divided the benefits for each scenario into economic and non-economic components and compared them to what would have been received under the Pension Act to serve as an initial benchmark for what was provided before the New Veterans Charter came into force.
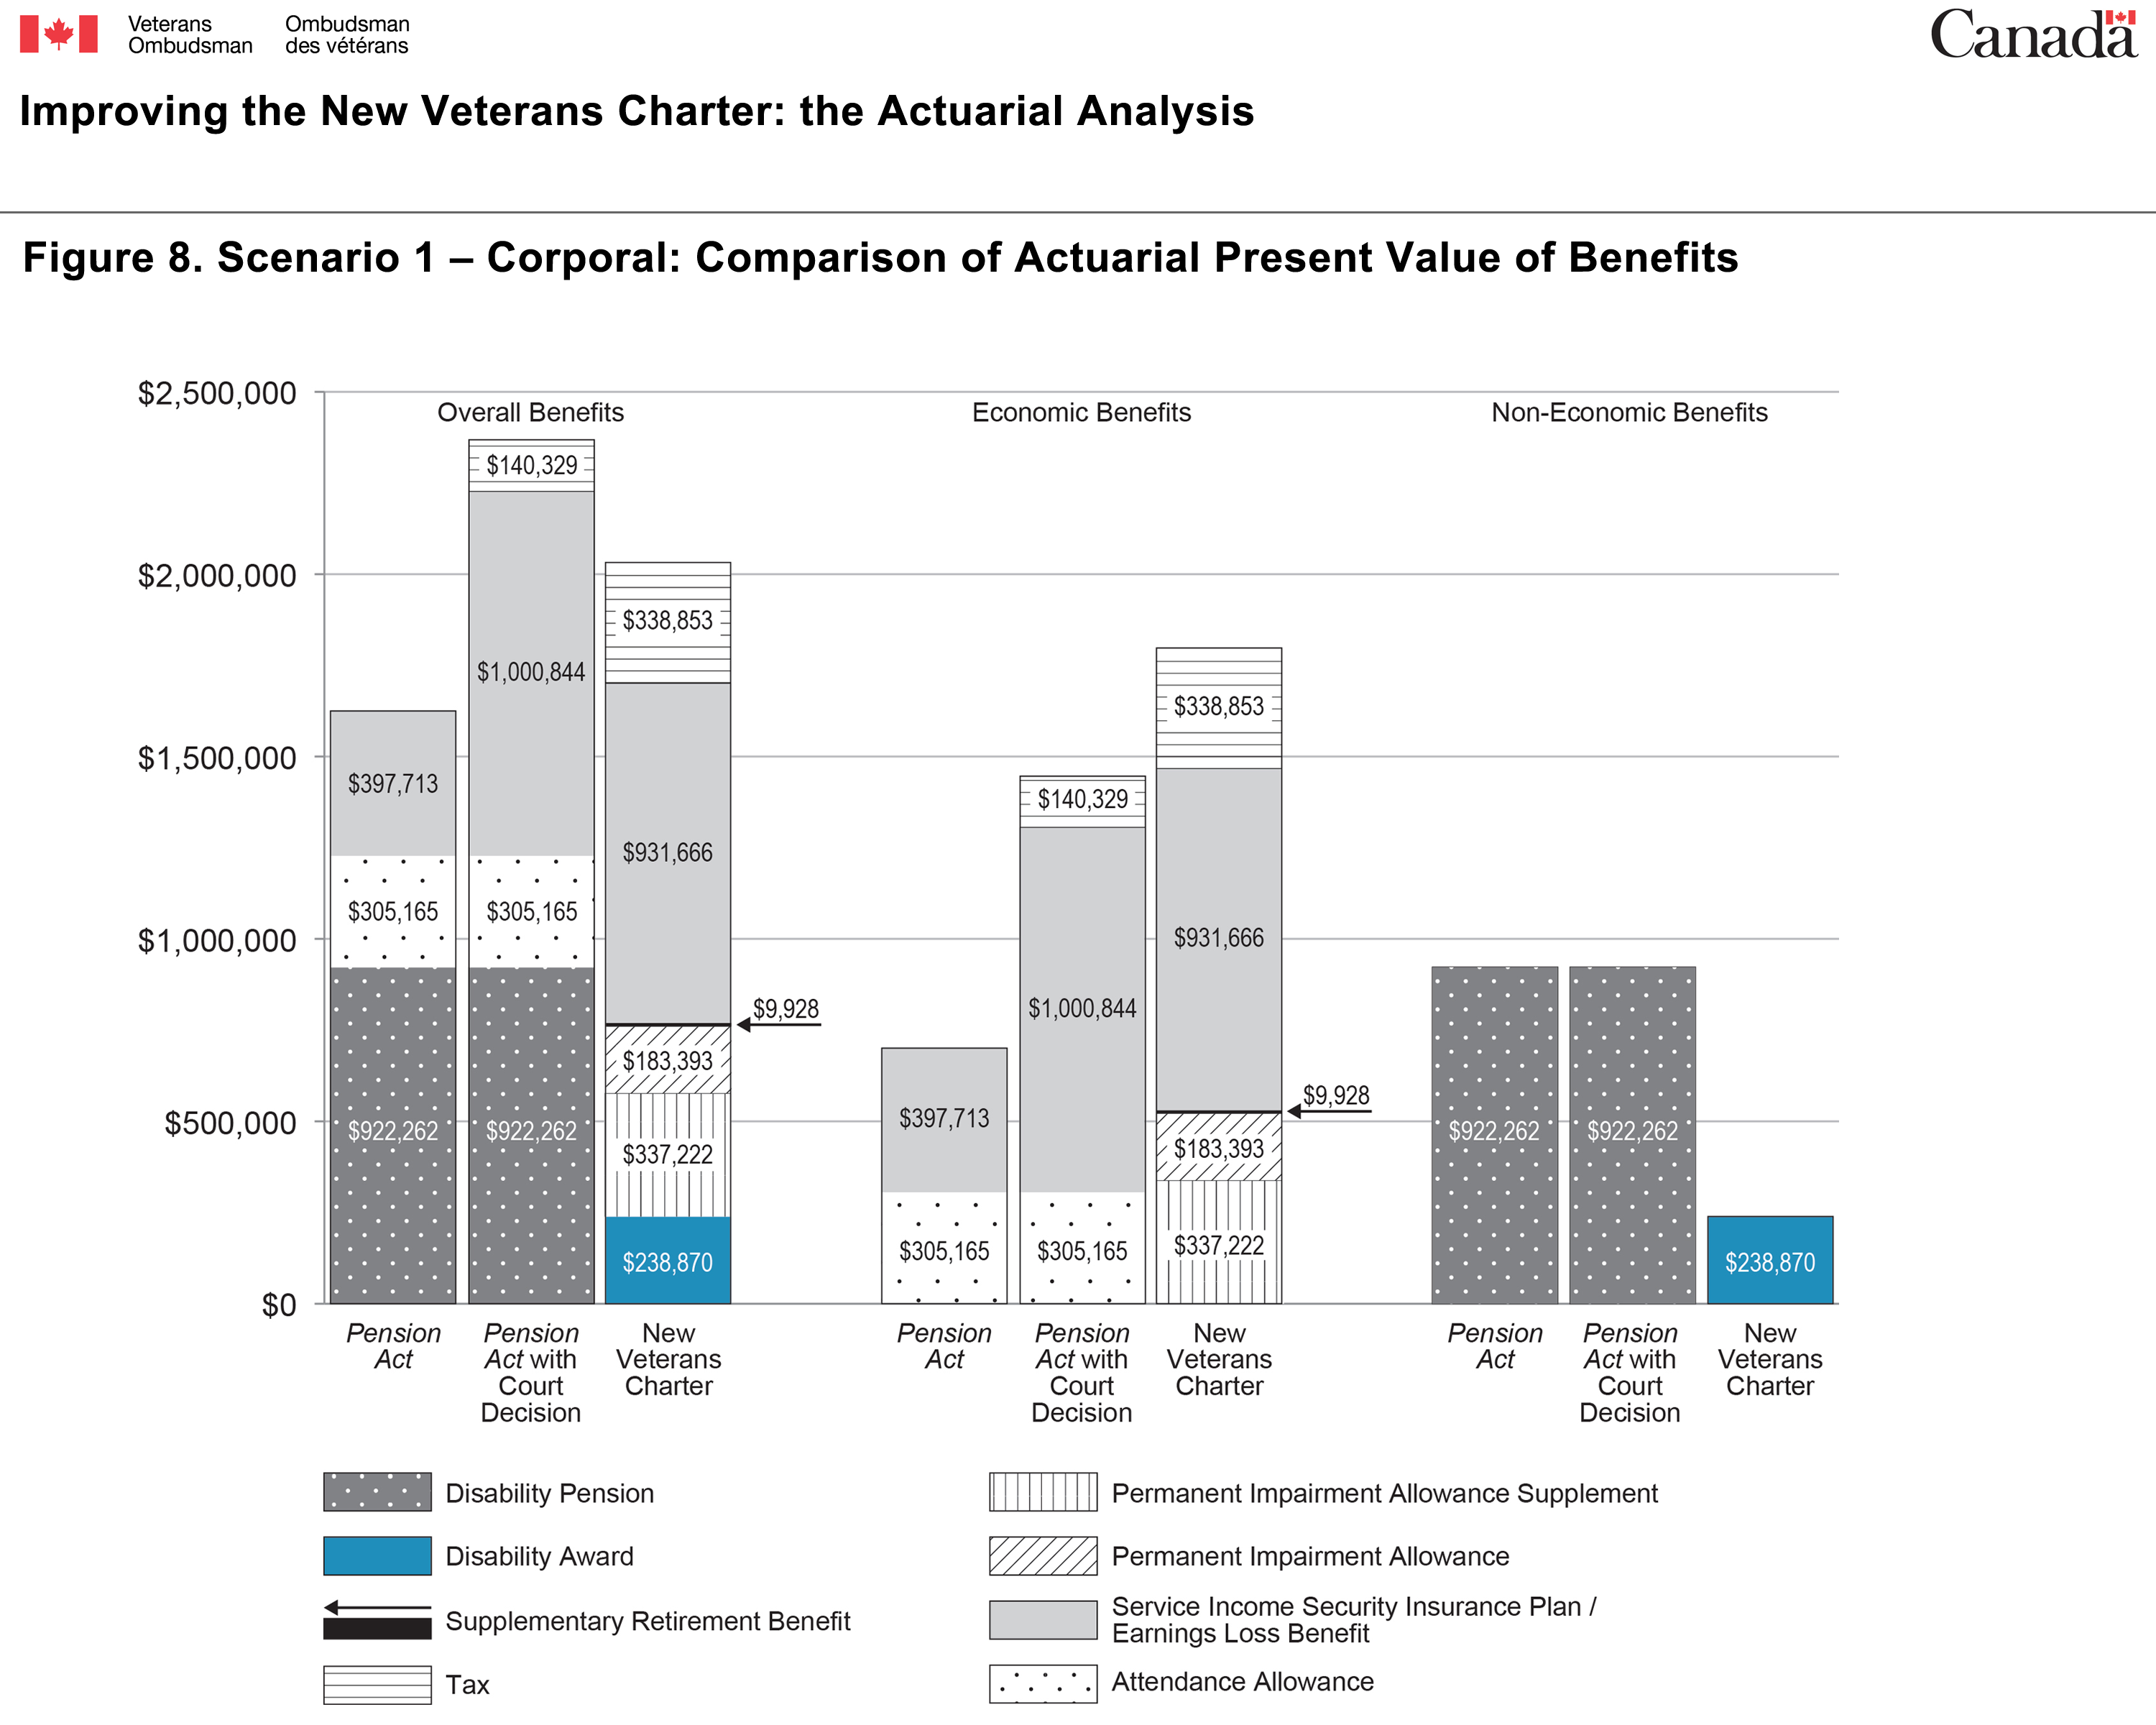
Figure 8. Scenario 1 – Corporal: Comparison of Actuarial Present Value of Benefits
| Category | Overall Benefits | ||
|---|---|---|---|
| Pension Act (dollars) | Pension Act with Court Decision (dollars) | New Veterans Charter (dollars) | |
| Tax | 0 | 140,329 | 338,853 |
| Permanent Impairment Allowance Supplement | 0 | 0 | 337,222 |
| Permanent Impairment Allowance | 0 | 0 | 183,393 |
| Supplementary Retirement Benefit | 0 | 0 | 9,928 |
| Disability Award | 0 | 0 | 238,870 |
| Disability Pension | 922,262 | 922,262 | 0 |
| Attendance Allowance | 305,165 | 305,165 | 0 |
| Service Income Security Insurance Plan / Earnings Loss Benefit | 397,713 | 1,000,844 | 931,666 |
| Category | Economic Benefits | ||
|---|---|---|---|
| Pension Act (dollars) | Pension Act with Court Decision (dollars) | New Veterans Charter (dollars) | |
| Tax | 0 | 140,329 | 338,853 |
| Permanent Impairment Allowance Supplement | 0 | 0 | 337,222 |
| Permanent Impairment Allowance | 0 | 0 | 183,393 |
| Supplementary Retirement Benefit | 0 | 0 | 9,928 |
| Disability Award | 0 | 0 | 0 |
| Disability Pension | 0 | 0 | 0 |
| Attendance Allowance | 305,165 | 305,165 | 0 |
| Service Income Security Insurance Plan / Earnings Loss Benefit | 397,713 | 1,000,844 | 931,666 |
| Category | Non-Economic Benefits | ||
|---|---|---|---|
| Pension Act (dollars) | Pension Act with Court Decision (dollars) | New Veterans Charter (dollars) | |
| Tax | 0 | 0 | 0 |
| Permanent Impairment Allowance Supplement | 0 | 0 | 0 |
| Permanent Impairment Allowance | 0 | 0 | 0 |
| Supplementary Retirement Benefit | 0 | 0 | 0 |
| Disability Award | 0 | 0 | 238,870 |
| Disability Pension | 922,262 | 922,262 | 0 |
| Attendance Allowance | 0 | 0 | 0 |
| Service Income Security Insurance Plan / Earnings Loss Benefit | 0 | 0 | 0 |
The above figure shows the overall value of the benefits for Scenario 1 and then divides those totals into economic and non-economic components. As can be seen with this particular scenario, the New Veterans Charter provides better economic compensation than what is available under the Pension Act. If the focus is first on meeting Veterans' economic needs and those needs are adequately addressed, then the discussion of what is fair compensation for pain and suffering can be addressed afterwards knowing that financial security is already achieved. The present actuarial analysis focuses on identifying potential gaps in achieving financial security with an understanding that a separate review and consultation will need to occur on fair compensation for pain and suffering, once financial security is assured throughout the life of the Veteran.
Analyzing the lifetime effects of these benefits in Figure 8 indicates where there could be gaps in compensation, but it does not provide the details necessary to show the yearly cash flow to the Veteran, which is another indicator of potential financial risk. Using the example below, the financial effects of the benefit package on a year-to-year basis can be seen. This breakdown makes it possible to predict whether financial security is assured throughout the life of the Veteran.
Figure 9. Scenario 1 – Corporal: Annual Nominal Economic Payments (After-Tax)

| Age | Pension Act (dollars) | Enhanced New Veterans Charter (dollars) |
|---|---|---|
| 24 | 44,721 | 49,527 |
| 29 | 49,600 | 54,681 |
| 34 | 55,018 | 60,372 |
| 39 | 61,032 | 66,655 |
| 44 | 67,710 | 73,591 |
| 49 | 75,126 | 81,251 |
| 54 | 83,362 | 89,707 |
| 59 | 92,511 | 99,044 |
| 64 | 102,674 | 109,353 |
| 69 | 25,026 | 38,406 |
| 74 | 28,314 | 42,403 |
| 79 | 32,035 | 46,817 |
This figure clearly demonstrates, for Scenario 1, the overall effect of the Enhanced New Veterans Charter providing better economic benefits. A more detailed analysis of this figure can be found in Appendix B.
Finally, individual modelling allows a comparison of the effects of potential future solutions. For example, the following figure compares the financial effects under the New Veterans Charter with the New Veterans Charter with a hypothetical $50,000 increase to the maximum Disability Award for Scenario 1.Footnote 29
Figure 10. Scenario 1 – Present Values of Benefits

| Category | New Veterans Charter (dollars) | Enhanced New Veterans Charter Increased Disability Award Maximum (dollars) |
|---|---|---|
| Taxes | 343,443 | 343,443 |
| Permanent Impairment Allowance | 194,988 | 194,988 |
| Permanent Impairment Allowance Supplement | 358,453 | 358,453 |
| Supplementary Retirement Benefit | 5,957 | 5,957 |
| Service Income Security Insurance Plan / Earnings Loss Benefit | 950,937 | 950,937 |
| Disability Award | 238,870 | 280,000 |
Results Summary
An analysis of benefits, either as a total over the lifetime of the Veteran or on an annual basis, must take into consideration whether the benefits are being provided for economic or non-economic purposes. Only in this manner will one be able to determine whether economic needs are being met, without confusing the debate with what is fair compensation for pain and suffering.
Overall, the actuarial analysis of individual scenarios conducted by the Office showed that:
- The totally and permanently incapacitated designation provides the best indication of which Veterans may be at financial risk.
- Out of the 1,428 totally and permanently incapacitated Veterans, 406 are receiving no allowances or Canadian Forces Superannuation payments.
- Financial security after age 65 for totally and permanently incapacitated Veterans who are not in receipt of allowances or Canadian Forces Superannuation payments is a concern.
- The Permanent Impairment Allowance and the Permanent Impairment Allowance Supplement have an important, positive effect on a Veteran's financial security.
- Compensation for pain and suffering is lower under the New Veterans Charter than the Pension Act.
- The New Veterans Charter generally provides higher compensation for economic loss as compared to the Pension Act.
ConclusionTop of Page
With the parliamentary committee reviewFootnote 30 being undertaken in October 2013, the Office of the Veterans Ombudsman’s publication series Improving the New Veterans Charter: the Parliamentary Review provides factual information about New Veterans Charter programs to help frame the debate. The four-part series considers the whole-of-government effect when it comes to the administration of Veterans' benefits and should provide greater detail of how collectively various government programs and initiatives align to support Veterans. Understanding how the various support structures align should prevent debating the merits of one benefit versus another without considering the overall effect of how all of these benefits fit in the broader context.
Analysing the combined effects of all benefits does not provide an objective or useful comparison between the Pension Act and the New Veterans Charter. Looking separately at the economic and non-economic categories of benefits allows differentiating what areas need to be focused on and how they should be prioritized.
Unlike other studies that have been conducted, this actuarial analysis also provides the detailed demographic information that is necessary to analyse the impact on the Veterans population of various potential solutions. This presents a common understanding of which Veterans are most at risk and helps identify what solutions and initiatives need to have priority.
The fact that actuarial methodology has been applied to the modelling should instill a level of confidence that the information presented is factual and can be used as a basis for assisting the Government of Canada in providing and developing programs that meet the current and future needs of Veterans.
Appendix A: Actuarial Accounting Principles
Pension Accounting Principles Important to the Model
Pension accounting is a complex field. It is useful for the purpose of this document to explain some of the concepts and principles relevant to pension accounting, which were also used in the development of the Office of the Veterans Ombudsman’s comparative model. When conducting comparative financial analysis of the Pension Act and the New Veterans Charter, very often the tendency is to do a very basic calculation to determine whether one benefit compared to another has more value. To provide an objective comparison and truly understand the full long-term costs and effects of a benefit scheme one has to take into account the following basic factors.
Figure 11. Pension Accounting Principles, is a flowchart diagram that graphically represents the pension accounting principles starting with 'Nominal Value', followed vertically by 'Purchasing Power', 'Present Value' and 'Actuarial Present Value' (downward-pointing arrows are used to connect each of these four blocks vertically).

'Inflation Rate' is to the left and joined by a thinner arrow to the thick arrow between 'Nominal Value' and 'Purchasing Power'.
'Interest Rate' is to the left and joined by a thinner arrow to the thick arrow between 'Purchasing Power' and 'Present Value'.
'Mortality Rate' is to the left and joined by a thinner arrow to the thick arrow between 'Present Value' and 'Actuarial Present Value'.
Nominal Value
Nominal value refers to the value that is obtained without taking into consideration the inflation effect. It is the value calculated during a specific time period based on the prices of that period. The nominal value of a benefit is in terms of money paid rather than in terms of purchasing power. This is a very simplistic calculation that the average person often uses to determine quickly the dollar amount of the benefits they receive.
Inflation Rate
Inflation is a rise in the general level of prices of goods and services in an economy over a period of time. When the general price level rises, each unit of currency buys fewer goods and services. Consequently, inflation also reflects erosion in the purchasing power of money—a loss of real value in the internal medium of exchange and unit of account within the economy. A chief measure of price inflation is the inflation rate, the annualized percentage change in a general price index (normally the consumer price index) over time.Footnote 31
Purchasing Power
Purchasing power refers to the value of a currency expressed in terms of the amount of goods or services that one unit of money can buy. The nominal value of money is adjusted for inflation to obtain the purchasing power of the money. This is used to determine if the benefits Veterans receive today can purchase the same amount of goods and services as in previous years to maintain the same standard of living.
Interest Rate
Interest rate is a rate that is charged by the lender to the borrower for the use of assets (such as money) expressed as a percentage of the principal. It is calculated by dividing the amount of interest by the amount of principal.
Present Value
Present value takes into account the interest rate and inflation rate. It is the future amount of money adjusted for inflation and discounted by an interest rate to reflect the current value. A dollar today is worth more than a dollar tomorrow because the dollar can be invested and earn a day's worth of interest, making the total accumulated value more than a dollar tomorrow. This is used by government to determine the amount of money needed today to generate the benefit payments for Veterans in the future that have the same purchasing power to ensure the same standard of living.
Mortality Rate
Mortality rate is the rate that measures the number of deaths in a population, typically expressed in units of death per 1,000 individuals per year. Mortality tables (also called life tables or actuarial tables) can be constructed based on mortality statistics to show the probability a person of a specific age will die before his or her next birthday in the given population. The life expectancy of an individual in the population can then be estimated using the mortality table.
Actuarial Present Value
Actuarial present value is the present value of life-contingent (dependent on life expectancy) cash flows.Footnote 32 The probability of a future payment is based on assumptions about the person's future mortality that is typically estimated using a life table. This is used by the government to estimate the present value of expected amount of benefits that are payable in the future.
Appendix B: Modelling Results
Economic vs. Non-Economic Benefits
The New Veterans Charter categorizes benefits as either economic or non-economic. The former are paid with “the objective of compensating for the earnings lost due to injury or illness resulting primarily from service.”Footnote 33 The latter are paid “in recognition of pain and suffering, physical and/or psychological loss, functional impairment and impact on the member's or the Veteran's overall quality of life and the impact on the lives of the member's or the Veteran's family.” Footnote 34
By combining both categories of benefits it is difficult to discern whether financial security is being achieved for the Veteran and if the Veteran has been fairly compensated for pain and suffering. To provide that insight, the Office of the Veterans Ombudsman divided the benefits for each scenario into their economic and non-economic components and compared them to what a Veteran would have received under the Pension Act in order to establish an initial benchmark for what was provided to the Veteran before the New Veterans Charter came into force.
If the focus is first on meeting Veterans’ economic needs and those needs are adequately addressed, then the discussion of what is fair compensation for pain and suffering can take place knowing that financial security is already achieved. Therefore, this actuarial analysis focuses on identifying potential gaps to achieve financial security with an understanding that a separate review and consultation will need to occur on fair compensation for pain and suffering, once financial security is assured throughout the life of the Veteran.
Individual Modelling
Because there are almost as many possible scenarios as there are Veterans, to focus discussion and provide a broad overview of potential areas of concern, scenarios that represent broad categories within the Veterans’ demographic were developed. While there will always be exceptions, this allows conclusions to be made based on a realistic sample of Veterans’ situations. To that end, Improving the New Veterans Charter: the Report and the Actuarial Analysis modelled these five general scenarios:
Figure 12. Summary of scenarios
| Scenario | Disability Assessment Level (in percent) | Age | Rank | Years of Service | Salary (in dollars) | Gender |
|---|---|---|---|---|---|---|
| 1 | 80 | 24 | Corporal | 4 | 55,464 | Male |
| 2 | 100 | 47 | Major | 29 | 110,640 | Female |
| 3 | 40 | 30 | Captain | 10 | 81,276 | Male |
| 4 | 95 | 35 | Sergeant | 15 | 63,720 | Male |
| 5 | 50 | 40 | Corporal | 5 | 56,286 | Female |
Scenarios representing totally and permanently incapacitated Veterans were used because this designation indicates that there are permanent barriers to transition such that Veterans cannot work, or cannot work at the income level they once had. This designation is based on an overall assessment of the Veterans’ current situation and is not dependent on indicators, such as disability level and disability condition or demographic indicators, such as age or family status. As a result, the totally and permanently incapacitated designation provides the first clear indicator that there is a significant barrier to Veterans’ transition that is affecting their ability to provide for themselves.
It is to be noted that one needs to be cautious of making direct comparisons between the results of each scenario, as the parameters for each are different. For example, the overall dollar values the Captain receives are comparable to what the Major receives, even though the Captain has a lower salary and level of disability. This is because the Captain was injured at a much younger age and was compensated for a greater period of time. If a direct comparison is to be made, at the minimum, the point of injury or illness needs to be the same.
Scenario 1 – Corporal
A totally and permanently incapacitated single 24-year-old male Veteran with an assessed disability level of 80 percent, who was medically released from the Canadian Forces at the rank of Corporal (salary of $55,464) with four years of service.
This scenario represents a young Veteran with a high level of disability, who has access to the Permanent Impairment Allowance and Supplement and very little pensionable service. There are currently 93 totally and permanently incapacitated Veterans who have a disability level between 78 percent and 82 percent, and 876 whose salary falls within $48,000 to $60,000.
Figure 13. Scenario 1 – Corporal: Comparison of Actuarial Present Value of Benefits

| Category | Overall Benefits | ||
|---|---|---|---|
| Pension Act (dollars) | Pension Act with Court Decision (dollars) | New Veterans Charter (dollars) | |
| Tax | 0 | 140,329 | 338,853 |
| Permanent Impairment Allowance Supplement | 0 | 0 | 337,222 |
| Permanent Impairment Allowance | 0 | 0 | 183,393 |
| Supplementary Retirement Benefit | 0 | 0 | 9,928 |
| Disability Award | 0 | 0 | 238,870 |
| Disability Pension | 922,262 | 922,262 | 0 |
| Attendance Allowance | 305,165 | 305,165 | 0 |
| Service Income Security Insurance Plan / Earnings Loss Benefit | 397,713 | 1,000,844 | 931,666 |
| Category | Economic Benefits | ||
|---|---|---|---|
| Pension Act (dollars) | Pension Act with Court Decision (dollars) | New Veterans Charter (dollars) | |
| Tax | 0 | 140,329 | 338,853 |
| Permanent Impairment Allowance Supplement | 0 | 0 | 337,222 |
| Permanent Impairment Allowance | 0 | 0 | 183,393 |
| Supplementary Retirement Benefit | 0 | 0 | 9,928 |
| Disability Award | 0 | 0 | 0 |
| Disability Pension | 0 | 0 | 0 |
| Attendance Allowance | 305,165 | 305,165 | 0 |
| Service Income Security Insurance Plan / Earnings Loss Benefit | 397,713 | 1,000,844 | 931,666 |
| Category | Non-Economic Benefits | ||
|---|---|---|---|
| Pension Act (dollars) | Pension Act with Court Decision (dollars) | New Veterans Charter (dollars) | |
| Tax | 0 | 0 | 0 |
| Permanent Impairment Allowance Supplement | 0 | 0 | 0 |
| Permanent Impairment Allowance | 0 | 0 | 0 |
| Supplementary Retirement Benefit | 0 | 0 | 0 |
| Disability Award | 0 | 0 | 238,870 |
| Disability Pension | 922,262 | 922,262 | 0 |
| Attendance Allowance | 0 | 0 | 0 |
| Service Income Security Insurance Plan / Earnings Loss Benefit | 0 | 0 | 0 |
Scenario 1 – Corporal: Points to Consider from the Above Comparison of Actuarial Present Value of Benefits
- Better economic benefits are paid under the New Veterans Charter, while the Pension Act provides more non-economic benefits.
- The effects of taxation are greater under the New Veterans Charter because the Permanent Impairment Allowance and Supplement are taxable, while the Attendance Allowance under the Pension Act is not.
- All allowances are modelled using the average allowance that is paid out. 91 percent of clients receiving the Permanent Impairment Allowance receive Grade 3, while 66 percent of clients receiving the Attendance Allowance receive Grade 4 or 5.
- The Supplementary Retirement Benefit has a minimal overall effect.
- Even with the effects of taxation, overall the New Veterans Charter provides more money from an economic perspective to the Veteran than what was provided under the Pension Act, with exception of those 7,500 Veterans who are affected by the Federal Court Decision.
Figure 14. Scenario 1 – Corporal: Annual Nominal Economic Payments (After-Tax)

| Age | Pension Act (dollars) | Enhanced New Veterans Charter (dollars) |
|---|---|---|
| 24 | 44,721 | 49,527 |
| 29 | 49,600 | 54,681 |
| 34 | 55,018 | 60,372 |
| 39 | 61,032 | 66,655 |
| 44 | 67,710 | 73,591 |
| 49 | 75,126 | 81,251 |
| 54 | 83,362 | 89,707 |
| 59 | 92,511 | 99,044 |
| 64 | 102,674 | 109,353 |
| 69 | 25,026 | 38,406 |
| 74 | 28,314 | 42,403 |
| 79 | 32,035 | 46,817 |
Scenario 1 – Corporal: Points to Consider from the Above Annual Economic Nominal Payment Figure
- The effect of the Earnings Loss Benefit ceases at age 65, and after that age income is composed of various allowances. To provide a realistic view of what most totally and permanently incapacitated Veterans receive, the allowances modelled in the scenarios show the average allowances paid out and not the maximum allowances received by only a few Veterans.
- The New Veterans Charter economic support after age 65 is significantly higher because the Permanent Impairment Supplement is a fixed amount (approximately $1,000) and is automatically paid to someone in receipt of the Permanent Impairment Allowance and designated as totally and permanently incapacitated. All the other allowances have various levels and eligibility requirements and statistically are paid out at the lower dollar levels.
- The upward curves of the graphs are the effects of indexing for inflation over time.
Scenario 2 – Major
A totally and permanently incapacitated 47-year-old female Veteran with an assessed disability level of 100 percent, married with one dependent child, who was medically released from the Canadian Forces at the rank of Major (salary of $110,640) with 29 years of service.
This scenario represents an older Veteran with a very serious disability who has access to the Permanent Impairment Allowance and Supplement and a high number of years of pensionable service. There are currently 290 totally and permanently incapacitated Veterans who have a disability level between 98 percent and 100 percent, and 36 whose salary is greater than $96,000.
Figure 15. Scenario 2 – Major: Comparison of Actuarial Present Value of Benefits

| Category | Overall Benefits | ||
|---|---|---|---|
| Pension Act (dollars) | Pension Act with Court Decision (dollars) | New Veterans Charter (dollars) | |
| Tax | 119,972 | 267,669 | 436,492 |
| Permanent Impairment Allowance Supplement | 0 | 0 | 218,844 |
| Permanent Impairment Allowance | 0 | 0 | 119,016 |
| Supplementary Retirement Benefit | 0 | 0 | 16,739 |
| Disability Award | 0 | 0 | 298,588 |
| Disability Pension | 788,622 | 788,622 | 0 |
| Attendance Allowance | 347,921 | 347,921 | 0 |
| Service Income Security Insurance Plan / Earnings Loss Benefit | 617,136 | 940,280 | 904,277 |
| Category | Economic Benefits | ||
|---|---|---|---|
| Pension Act (dollars) | Pension Act with Court Decision (dollars) | New Veterans Charter (dollars) | |
| Tax | 119,972 | 267,669 | 436,492 |
| Permanent Impairment Allowance Supplement | 0 | 0 | 218,844 |
| Permanent Impairment Allowance | 0 | 0 | 119,016 |
| Supplementary Retirement Benefit | 0 | 0 | 16,739 |
| Disability Award | 0 | 0 | 0 |
| Disability Pension | 0 | 0 | 0 |
| Attendance Allowance | 347,921 | 347,921 | 0 |
| Service Income Security Insurance Plan / Earnings Loss Benefit | 617,136 | 940,280 | 904,277 |
| Category | Non-Economic Benefits | ||
|---|---|---|---|
| Pension Act (dollars) | Pension Act with Court Decision (dollars) | New Veterans Charter (dollars) | |
| Tax | 0 | 0 | 0 |
| Permanent Impairment Allowance Supplement | 0 | 0 | 0 |
| Permanent Impairment Allowance | 0 | 0 | 0 |
| Supplementary Retirement Benefit | 0 | 0 | 0 |
| Disability Award | 0 | 0 | 298,588 |
| Disability Pension | 788,622 | 788,622 | 0 |
| Attendance Allowance | 0 | 0 | 0 |
| Service Income Security Insurance Plan / Earnings Loss Benefit | 0 | 0 | 0 |
Scenario 2 – Major: Points to Consider from the Above Comparison of Actuarial Present Value of Benefits
- Even with the effects of taxation, economic benefits paid under the New Veterans Charter are better than those paid under the Pension Act and comparable to those received by approximately 7,500 Veterans who are receiving Pension Act benefits and are affected by the Federal Court Decision. The Pension Act compensates better for non-economic benefits.
- The effects of taxation are greater under the New Veterans Charter because the Permanent Impairment Allowance and Supplement are taxable while the Attendance Allowance under the Pension Act is not. The effects of taxation are also greater in this scenario due to the higher salary the Major receives, placing her in a higher tax bracket.
- All allowances are modelled using the average allowance that is paid out. 91 percent of clients receiving the Permanent Impairment Allowance receive Grade 3, while 66 percent of clients receiving the Attendance Allowance receive Grade 4 or 5.
- The Supplementary Retirement Benefit has minimal overall effect.
- In general, the New Veterans Charter provides more money to the Veteran than the Pension Act, but the effects of taxation result in less money in the Veteran’s pocket. The gap in net monies is even larger for the approximate 7,500 Veterans who are affected by the Federal Court Decision.
Figure 16. Scenario 2 – Major: Annual Nominal Economic Payments(After-Tax)

| Age | Pension Act (dollars) | Enhanced New Veterans Charter (dollars) |
|---|---|---|
| 47 | 75,891 | 67,635 |
| 52 | 83,790 | 74,758 |
| 57 | 92,510 | 82,632 |
| 62 | 102,139 | 91,339 |
| 67 | 21,373 | 22,497 |
| 72 | 23,598 | 25,453 |
| 77 | 26,053 | 28,798 |
Scenario 2 – Major: Points to Consider from the Above Annual Economic Nominal Payment Figure
- The effect of the Earnings Loss Benefit ceases at age 65 and after that age income is composed of various allowances. To provide a realistic view of what most totally and permanently incapacitated Veterans receive, the allowances modelled in the scenarios show the average allowances paid out and not the maximum allowances received by only a few Veterans.
- The New Veterans Charter economic support after age 65 is significantly higher due to the fact that the Permanent Impairment Supplement is a fixed amount (approximately $1,000) and is automatically paid to someone in receipt of the Permanent Impairment Allowance who is designated as totally and permanently incapacitated. All the other allowances have various levels and eligibility requirements and statistically are paid out at the lower dollar levels.
- The upward curves of the graphs are the effects of indexing for inflation over time.
Scenario 3 – Captain
A totally and permanently incapacitated 30-year-old male Veteran with an assessed disability level of 40 percent, married with one dependent child, who was medically released from the Canadian Forces at the rank of Captain (salary of $81,276) with 10 years of service.
This scenario represents a young Veteran with a moderate level of disability who has access to the Permanent Impairment Allowance and Supplement, who receives a small but immediate unreduced Canadian Forces annuity and who cannot return to work because of the nature of his disability. There are currently 63 totally and permanently incapacitated Veterans who have a disability level between 38 percent and 42 percent, and 36 whose salary falls within $72,000 to $84,000.
Figure 17. Scenario 3 – Captain : Comparison of Actuarial Present Value of Benefits

| Category | Overall Benefits | ||
|---|---|---|---|
| Pension Act (dollars) | Pension Act with Court Decision (dollars) | New Veterans Charter (dollars) | |
| Tax | 178,396 | 281,983 | 449,691 |
| Permanent Impairment Allowance Supplement | 0 | 0 | 304,033 |
| Permanent Impairment Allowance | 0 | 0 | 165,344 |
| Supplementary Retirement Benefit | 0 | 0 | 16,739 |
| Disability Award | 0 | 0 | 119,435 |
| Disability Pension | 427,375 | 427,375 | 0 |
| Attendance Allowance | 282,826 | 282,826 | 0 |
| Service Income Security Insurance Plan / Earnings Loss Benefit | 991,525 | 1,217,463 | 1,180,503 |
| Category | Economic Benefits | ||
|---|---|---|---|
| Pension Act (dollars) | Pension Act with Court Decision (dollars) | New Veterans Charter (dollars) | |
| Tax | 178,396 | 281,983 | 449,691 |
| Permanent Impairment Allowance Supplement | 0 | 0 | 304,033 |
| Permanent Impairment Allowance | 0 | 0 | 165,344 |
| Supplementary Retirement Benefit | 0 | 0 | 16,739 |
| Disability Award | 0 | 0 | 0 |
| Disability Pension | 0 | 0 | 0 |
| Attendance Allowance | 282,826 | 282,826 | 0 |
| Service Income Security Insurance Plan / Earnings Loss Benefit | 991,525 | 1,217,463 | 1,180,503 |
| Category | Non-Economic Benefits | ||
|---|---|---|---|
| Pension Act (dollars) | Pension Act with Court Decision (dollars) | New Veterans Charter (dollars) | |
| Tax | 0 | 0 | 0 |
| Permanent Impairment Allowance Supplement | 0 | 0 | 0 |
| Permanent Impairment Allowance | 0 | 0 | 0 |
| Supplementary Retirement Benefit | 0 | 0 | 0 |
| Disability Award | 0 | 0 | 119,435 |
| Disability Pension | 427,375 | 427,375 | 0 |
| Attendance Allowance | 0 | 0 | 0 |
| Service Income Security Insurance Plan / Earnings Loss Benefit | 0 | 0 | 0 |
Scenario 3 – Captain: Points to Consider from the Above Comparison of Actuarial Present Value of Benefits
- Better economic benefits are paid under the New Veterans Charter, while the Pension Act compensates better for non‑economic benefits.
- The effects of taxation are greater under the New Veterans Charter because the Permanent Impairment Allowance and Supplement are taxable while the Attendance Allowance under the Pension Act is not. The effects of taxation are also greater in this scenario due to the higher salary the Captain receives, placing this Veteran in a higher tax bracket. The effects of taxation seem larger than what was shown in Scenario 2 – Major, but in this scenario the Captain was injured 17 years earlier than the Major and is therefore in receipt of benefits for a much longer period of time.
- All allowances are modelled using the average allowance that is paid out. 91 percent of clients receiving the Permanent Impairment Allowance receive Grade 3, while 66 percent of clients receiving the Attendance Allowance receive Grade 4 or 5.
- The Supplementary Retirement Benefit has minimal overall effect.
- Even with the effects of taxation, overall the New Veterans Charter provides more money to the Veteran than the Pension Act, with the exception of the approximate 7,500 Veterans who are affected by the Federal Court Decision.
Figure 18. Scenario 3 – Captain: Annual Nominal Economic Payments(After-Tax)

| Age | Pension Act (dollars) | Enhanced New Veterans Charter (dollars) |
|---|---|---|
| 30 | 57,732 | 62,855 |
| 35 | 63,964 | 69,396 |
| 40 | 70,877 | 76,619 |
| 45 | 78,543 | 84,594 |
| 50 | 87,044 | 93,397 |
| 55 | 96,471 | 103,118 |
| 60 | 106,930 | 113,850 |
| 65 | 19,550 | 66,923 |
| 70 | 22,119 | 33,512 |
| 75 | 25,026 | 37,000 |
| 80 | 28,314 | 40,852 |
Scenario 3 – Captain: Points to Consider from the Above Annual Economic Nominal Payment Figure
- The effect of the Earnings Loss Benefit ceases at age 65 and after that age, income is composed of various allowances. To provide a realistic view of what most totally and permanently incapacitated Veterans receive, the allowances modelled in the scenarios show the average allowances paid out and not the maximum allowances received by only a few Veterans.
- The New Veterans Charter economic support after age 65 is significantly higher because the Permanent Impairment Supplement is a fixed amount (approximately $1,000) and is automatically paid to someone in receipt of the Permanent Impairment Allowance and designated as totally and permanently incapacitated. All the other allowances have various levels and eligibility requirements and are statistically paid out at the lower dollar levels.
- The upward curves of the graphs are the effects of indexing for inflation over time.
Scenario 4 – Sergeant
A totally and permanently incapacitated 35 year old male Veteran with an assessed disability level of 95 percent, married with one dependent child, who was medically released from the Canadian Forces at the rank of Sergeant (salary $63,720) with 15 years of service.
This scenario represents a Veteran with a very high level of disability who has access to the Permanent Impairment Allowance and Supplement, who receives a modest but immediate unreduced Canadian Forces annuity and who cannot work because of the seriousness of his disability.There are currently 46 totally and permanently incapacitated Veterans who have a disability level between 93 percent and 97 percent, and 93 whose salary falls within $60,000 and $72,000.
Figure 19. Scenario 4 – Sergeant: Comparison of Actuarial Present Value of Benefits

| Category | Overall Benefits | ||
|---|---|---|---|
| Pension Act (dollars) | Pension Act with Court Decision (dollars) | New Veterans Charter (dollars) | |
| Tax | 0 | 157,528 | 315,495 |
| Permanent Impairment Allowance Supplement | 0 | 0 | 291,304 |
| Permanent Impairment Allowance | 0 | 0 | 158,421 |
| Supplementary Retirement Benefit | 0 | 0 | 10,011 |
| Disability Award | 0 | 0 | 283,659 |
| Disability Pension | 942,398 | 942,398 | 0 |
| Attendance Allowance | 262,593 | 262,593 | 0 |
| Service Income Security Insurance Plan / Earnings Loss Benefit | 357,684 | 892,009 | 0 |
| Category | Economic Benefits | ||
|---|---|---|---|
| Pension Act (dollars) | Pension Act with Court Decision (dollars) | New Veterans Charter (dollars) | |
| Tax | 0 | 157,528 | 315,495 |
| Permanent Impairment Allowance Supplement | 0 | 0 | 218,844 |
| Permanent Impairment Allowance | 0 | 0 | 119,016 |
| Supplementary Retirement Benefit | 0 | 0 | 10,011 |
| Disability Award | 0 | 0 | 0 |
| Disability Pension | 0 | 0 | 0 |
| Attendance Allowance | 262,593 | 262,593 | 0 |
| Service Income Security Insurance Plan / Earnings Loss Benefit | 357,684 | 892,009 | 846,139 |
| Category | Non-Economic Benefits | ||
|---|---|---|---|
| Pension Act (dollars) | Pension Act with Court Decision (dollars) | New Veterans Charter (dollars) | |
| Tax | 0 | 0 | 0 |
| Permanent Impairment Allowance Supplement | 0 | 0 | 0 |
| Permanent Impairment Allowance | 0 | 0 | 0 |
| Supplementary Retirement Benefit | 0 | 0 | 0 |
| Disability Award | 0 | 0 | 283,659 |
| Disability Pension | 942,398 | 942,398 | 0 |
| Attendance Allowance | 0 | 0 | 0 |
| Service Income Security Insurance Plan / Earnings Loss Benefit | 0 | 0 | 0 |
Scenario 4 – Sergeant: Points to Consider from the Above Comparison of Actuarial Present Value of Benefits
- Better economic benefits are paid under the New Veterans Charter, while the Pension Act compensates more for non‑economic benefits.
- The effects of taxation are greater under the New Veterans Charter because the Permanent Impairment Allowance and Supplement are taxable while the Attendance Allowance under the Pension Act is not.
- All allowances are modelled using the average allowance that is paid out. Ninety-one percent of clients receiving the Permanent Impairment Allowance receive Grade 3, while 66 percent of clients receiving the Attendance Allowance receive Grade 4 or 5.
- The Supplementary Retirement Benefit has minimal overall effect.
- Even with the effects of taxation, overall the New Veterans Charter provides more money to the Veteran than the Pension Act, with the exception of the approximate 7,500 Veterans who are affected by the Federal Court Decision.
Figure 20. Scenario 4 – Sergeant: Annual Nominal Economic Payments (After-Tax)

| Age | Pension Act (dollars) | Enhanced New Veterans Charter (dollars) |
|---|---|---|
| 35 | 48,855 | 53,790 |
| 40 | 54,164 | 59,387 |
| 45 | 60,057 | 65,569 |
| 50 | 66,596 | 72,393 |
| 55 | 73,853 | 79,926 |
| 60 | 81,909 | 88,245 |
| 65 | 17,279 | 51,401 |
| 70 | 19,550 | 31,065 |
| 75 | 22,119 | 34,298 |
| 80 | 25,026 | 37,868 |
Scenario 4 – Sergeant: Points to Consider from the Above Annual Economic Nominal Payment Figure
- The effect of the Earnings Loss Benefit ceases at age 65 and after that age, income is composed of various allowances. To provide a realistic view of what most totally and permanently incapacitated Veterans receive, the allowances modelled in the scenarios show the average allowances paid out and not the maximum allowances received by only a few Veterans.
- The New Veterans Charter economic support after age 65 is significantly higher because the Permanent Impairment Supplement is a fixed amount (approximately $1,000) and is automatically paid to someone in receipt of the Permanent Impairment Allowance and designated as totally and permanently incapacitated. All the other allowances have various levels and eligibility requirements and are statistically paid out at the lower dollar levels
- The upward curves of the graphs are the effects of indexing for inflation over time.
Scenario 5 – Corporal without Allowances
A totally and permanently incapacitated 40-year-old female Veteran with an assessed disability level of 50 percent, married with one dependent child, who was medically released from the Canadian Forces at the rank of Corporal (salary of $56,286) with five years of service.
This scenario represents a moderately disabled Veteran who joined the Canadian Forces later in life, who is not eligible for the Permanent Impairment Allowance and Supplement and who has few years of pensionable service.
There are currently 71 totally and permanently incapacitated Veterans who have a disability level between 48 percent and 52 percent and 876 whose salary falls within $48,000 and $60,000. As well, there are 761 totally and permanently incapacitated Veterans who are not receiving the Permanent Impairment Allowance and Supplement.
Figure 21. Scenario 5 – Corporal without Allowances: Comparison of Actuarial Present Value of Benefits

| Category | Overall Benefits | ||
|---|---|---|---|
| Pension Act (dollars) | Pension Act with Court Decision (dollars) | New Veterans Charter (dollars) | |
| Tax | 23,333 | 100,548 | 95,435 |
| Service Income Security Insurance Plan / Earnings Loss Benefit | 468,529 | 704,184 | 709,298 |
| Supplementary Retirement Benefit | 0 | 0 | 8,522 |
| Disability Award | 0 | 0 | 149,294 |
| Disability Pension | 455,139 | 455,139 | 0 |
| Category | Economic Benefits | ||
|---|---|---|---|
| Pension Act (dollars) | Pension Act with Court Decision (dollars) | New Veterans Charter (dollars) | |
| Tax | 23,333 | 100,548 | 95,435 |
| Service Income Security Insurance Plan / Earnings Loss Benefit | 468,529 | 704,184 | 709,298 |
| Supplementary Retirement Benefit | 0 | 0 | 8,522 |
| Disability Award | 0 | 0 | 0 |
| Disability Pension | 0 | 0 | 0 |
| Category | Non-Economic Benefits | ||
|---|---|---|---|
| Pension Act (dollars) | Pension Act with Court Decision (dollars) | New Veterans Charter (dollars) | |
| Tax | 0 | 0 | 0 |
| Service Income Security Insurance Plan / Earnings Loss Benefit | 0 | 0 | 0 |
| Supplementary Retirement Benefit | 0 | 0 | 0 |
| Disability Award | 0 | 0 | 149,294 |
| Disability Pension | 455,139 | 455,139 | 0 |
Scenario 5 – Corporal without Allowances: Points to Consider from the Above Comparison of Actuarial Present Value of Benefits
- Even with the effects of taxation, economic benefits paid under the New Veterans Charter are better than those paid under the Pension Act and comparable to those received by approximately 7,500 Veterans who are receiving Pension Act benefits and are affected by the Federal Court Decision. The Pension Act compensates better for non-economic benefits.
- Unlike the Veterans represented in the other scenarios, this Veteran is not in receipt of any allowances and is representative of a totally and permanently incapacitated Veteran who is classified as being at financial risk.
- The Supplementary Retirement Benefit has minimal overall effect.
- In general, the New Veterans Charter provides more money to the Veteran than the Pension Act, but the effects of taxation result in less money in the Veteran’s pocket. The gap in net monies is even larger for the approximate 7,500 Veterans who are affected by the Federal Court Decision.
Figure 22. Scenario 5 – Corporal without Allowances: Annual Nominal Economic Payments (After-Tax)

| Age | Pension Act (dollars) | Enhanced New Veterans Charter (dollars) |
|---|---|---|
| 40 | 36,940 | 36,940 |
| 45 | 40,785 | 40,785 |
| 50 | 45,029 | 45,029 |
| 55 | 49,716 | 49,716 |
| 60 | 54,891 | 54,891 |
| 65 | 0 | 0 |
| 70 | 0 | 0 |
| 75 | 0 | 0 |
| 80 | 0 | 0 |
Scenario 5 – Corporal without Allowances: Points to Consider from the Above Annual Economic Nominal Payment Figure
- The economic payments under the Pension Act and the New Veterans Charter are the same prior to age 65. The Veteran is either in receipt of the New Veterans Charter’s Extended Earnings Loss Benefit or the SISIP Long Term Disability payment, which provide the same dollar value amount.
- The Earnings Loss Benefit ceases at age 65. Without allowances, neither the Pension Act nor the New Veterans Charter provides any economic compensation after age 65. At this point, a Veteran may only have access to Old Age Security and Government Income Supplement payments to provide financial security. Canada Pension Plan or Canadian Forces Superannuation payments may not be available because the Veteran did not have the opportunity to pay into these plans long enough to receive a benefit.
- The slight difference in the curves on the graph at age 65 is due to the effect of receiving the New Veterans Charter Supplementary Retirement Benefit lump sum.
- The upward curves of the graphs are the effects of indexing for inflation over time.
Appendix C: Additional Modelling Results
Individual Modelling
The following figure is a reminder of the scenarios that were used for this actuarial analysis. A description of the individual scenarios can be found in the body of the analysis and in Appendix B.
Figure 23. Summary of Scenarios
| Scenario | Disability Assessment Level (in percent) | Age | Rank | Years of Service | Salary (in dollars) | Gender |
|---|---|---|---|---|---|---|
| 1 | 80 | 24 | Corporal | 4 | 55,464 | Male |
| 2 | 100 | 47 | Major | 29 | 110,640 | Female |
| 3 | 40 | 30 | Captain | 10 | 81,276 | Male |
| 4 | 95 | 35 | Sergeant | 15 | 63,720 | Male |
| 5 | 50 | 40 | Corporal | 5 | 56,286 | Female |
Survivors Modelling
Not only are Veterans affected by the New Veteran Charter’s outcomes, but so are survivors and children of Canadian Forces members or Veterans who die as a result of their service-related injuries or illness. Although the analysis shows that, overall, survivors are compensated better under the New Veterans Charter than under the Pension Act, the cash flow going to survivors ceases when the Veteran reaches the age of 65. The following figures show the effects of cash flow over time for each of the scenarios.
Figure 24. A) Net Annual Nominal Payments to Survivors of Scenario 1: Corporal
 Graphic version")
| Age | Pension Act (dollars) | Enhanced New Veterans Charter (dollars) |
|---|---|---|
| 24 | 31,431 | 268,418 |
| 29 | 26,407 | 37,286 |
| 34 | 29,877 | 41,167 |
| 39 | 33,803 | 45,451 |
| 44 | 38,245 | 50,182 |
| 49 | 43,271 | 55,405 |
| 54 | 48,957 | 61,172 |
| 59 | 55,390 | 67,538 |
| 64 | 62,669 | 74,568 |
| 69 | 70,904 | 0 |
| 74 | 80,222 | 0 |
| 79 | 90,763 | 0 |
Figure 24. B) Net Annual Nominal Payments to Survivors of Scenario 1: Corporal with Superannuation PaymentsFootnote 35
 Graphic version")
| Age | Pension Act (dollars) | Enhanced New Veterans Charter (dollars) | ||||
|---|---|---|---|---|---|---|
| 0 Years of Service | 10 Years of Service | 30 Years of Service | 0 Years of Service | 10 Years of Service | 30 Years of Service | |
| 24 | 31,431 | 36,255 | 45,904 | 268,418 | 268,418 | 268,418 |
| 29 | 26,407 | 31,734 | 42,387 | 37,286 | 37,286 | 37,286 |
| 34 | 29,877 | 35,758 | 47,520 | 41,167 | 41,167 | 41,167 |
| 39 | 33,803 | 40,296 | 53,282 | 45,451 | 45,451 | 45,451 |
| 44 | 38,245 | 45,414 | 59,752 | 50,182 | 50,182 | 50,182 |
| 49 | 43,271 | 51,186 | 67,016 | 55,405 | 55,405 | 55,405 |
| 54 | 48,957 | 57,696 | 75,173 | 61,172 | 61,172 | 61,172 |
| 59 | 55,390 | 65,038 | 84,335 | 67,538 | 67,538 | 67,538 |
| 64 | 62,669 | 73,322 | 94,627 | 74,568 | 74,568 | 74,568 |
| 69 | 70,904 | 82,665 | 106,188 | 0 | 11,761 | 35,284 |
| 74 | 80,222 | 93,207 | 119,178 | 0 | 12,985 | 38,986 |
| 79 | 90,763 | 105,100 | 133,774 | 0 | 14,337 | 43,011 |
Figure 25. A) Net Annual Nominal Payments to Survivors of Scenario 2: Major
 Graphic version")
| Age | Pension Act (dollars) | Enhanced New Veterans Charter (dollars) |
|---|---|---|
| 47 | 30,875 | 358,110 |
| 52 | 25,940 | 65,717 |
| 57 | 29,349 | 72,557 |
| 62 | 33,205 | 80,109 |
| 67 | 37,569 | 0 |
| 72 | 42,506 | 0 |
| 77 | 48,091 | 0 |
Figure 25. B) Net Annual Nominal Payments to Survivors of Scenario 2: Major with Superannuation PaymentsFootnote 36
 Graphic version")
| Age | Pension Act (dollars) | Enhanced New Veterans Charter (dollars) | ||||
|---|---|---|---|---|---|---|
| 0 Years of Service | 10 Years of Service | 30 Years of Service | 0 Years of Service | 10 Years of Service | 30 Years of Service | |
| 47 | 30,875 | 39,962 | 58,136 | 358,110 | 358,110 | 358,110 |
| 52 | 25,940 | 35,973 | 56,038 | 65,717 | 65,717 | 65,717 |
| 57 | 29,349 | 40,426 | 62,580 | 72,557 | 72,557 | 72,557 |
| 62 | 33,205 | 45,435 | 69,894 | 80,109 | 80,109 | 80,109 |
| 67 | 37,569 | 51,072 | 78,077 | 0 | 40,508 | 13,503 |
| 72 | 42,506 | 57,414 | 87,230 | 0 | 44,724 | 14,908 |
| 77 | 48,091 | 64,551 | 97,470 | 0 | 49,379 | 16,460 |
Figure 26. A) Net Annual Nominal Payments to Survivors of Scenario 3: Captain
 Graphic version")
| Age | Pension Act (dollars) | Enhanced New Veterans Charter (dollars) |
|---|---|---|
| 30 | 8,589 | 164,999 |
| 35 | 8,802 | 52,638 |
| 40 | 9,959 | 58,117 |
| 45 | 11,268 | 64,166 |
| 50 | 12,748 | 70,845 |
| 55 | 14,424 | 78,218 |
| 60 | 16,319 | 86,359 |
| 65 | 18,463 | 36,570 |
| 70 | 20,890 | 0 |
| 75 | 23,635 | 0 |
| 80 | 26,741 | 0 |
Figure 26. B) Net Annual Nominal Payments to Survivors of Scenario 3: Captain with Superannuation PaymentsFootnote 37
 Graphic version")
| Age | Pension Act (dollars) | Enhanced New Veterans Charter (dollars) | ||||
|---|---|---|---|---|---|---|
| 0 Years of Service | 10 Years of Service | 30 Years of Service | 0 Years of Service | 10 Years of Service | 30 Years of Service | |
| 30 | 8,589 | 15,702 | 29,927 | 164,999 | 164,999 | 164,999 |
| 35 | 8,802 | 16,655 | 32,360 | 52,638 | 52,638 | 52,638 |
| 40 | 9,959 | 18,629 | 35,969 | 58,117 | 58,117 | 58,117 |
| 45 | 11,268 | 20,841 | 39,986 | 64,166 | 64,166 | 64,166 |
| 50 | 12,748 | 23,317 | 44,454 | 70,845 | 70,845 | 70,845 |
| 55 | 14,424 | 26,093 | 49,431 | 78,218 | 78,218 | 78,218 |
| 60 | 16,319 | 29,202 | 54,969 | 86,359 | 86,359 | 86,359 |
| 65 | 18,463 | 32,687 | 61,136 | 36,570 | 50,794 | 79,243 |
| 70 | 20,890 | 36,595 | 68,004 | 0 | 15,705 | 47,114 |
| 75 | 23,635 | 40,974 | 75,653 | 0 | 17,339 | 52,018 |
| 80 | 26,741 | 45,885 | 84,173 | 0 | 19,144 | 57,432 |
Figure 27. A) Net Annual Nominal Payments to Survivors of Scenario 4: Sergeant
 Graphic version")
| Age | Pension Act (dollars) | Enhanced New Veterans Charter (dollars) |
|---|---|---|
| 35 | 31,431 | 316,898 |
| 40 | 26,407 | 42,236 |
| 45 | 29,877 | 46,633 |
| 50 | 33,803 | 51,486 |
| 55 | 38,245 | 56,844 |
| 60 | 43,271 | 62,761 |
| 65 | 48,957 | 23,265 |
| 70 | 55,390 | 0 |
| 75 | 62,669 | 0 |
| 80 | 70,904 | 0 |
Figure 27. B) Net Annual Nominal Payments to Survivors of Scenario 4: Sergeant with Superannuation PaymentsFootnote 38
 Graphic version")
| Age | Pension Act (dollars) | Enhanced New Veterans Charter (dollars) | ||||
|---|---|---|---|---|---|---|
| 0 Years of Service | 10 Years of Service | 30 Years of Service | 0 Years of Service | 10 Years of Service | 30 Years of Service | |
| 35 | 31,431 | 37,612 | 49,975 | 316,898 | 316,898 | 316,898 |
| 40 | 26,407 | 33,232 | 46,882 | 42,236 | 42,236 | 42,236 |
| 45 | 29,877 | 37,412 | 52,483 | 46,633 | 46,633 | 46,633 |
| 50 | 33,803 | 42,122 | 58,761 | 51,486 | 51,486 | 51,486 |
| 55 | 38,245 | 47,430 | 65,801 | 56,844 | 56,844 | 56,844 |
| 60 | 43,271 | 53,412 | 73,695 | 62,761 | 62,761 | 62,761 |
| 65 | 48,957 | 60,154 | 82,548 | 23,265 | 34,462 | 56,856 |
| 70 | 55,390 | 67,752 | 92,477 | 0 | 12,362 | 37,087 |
| 75 | 62,669 | 76,318 | 103,616 | 0 | 13,649 | 40,947 |
| 80 | 70,904 | 85,974 | 116,113 | 0 | 15,070 | 45,209 |
Figure 28. A) Net Annual Nominal Payments to Survivors of Scenario 5: Corporal without Allowances
 Graphic version")
| Age | Pension Act (dollars) | Enhanced New Veterans Charter (dollars) |
|---|---|---|
| 40 | 31,431 | 183,594 |
| 45 | 26,407 | 40,785 |
| 50 | 29,877 | 45,029 |
| 55 | 33,803 | 49,716 |
| 60 | 38,245 | 54,891 |
| 65 | 43,271 | 16,226 |
| 70 | 48,957 | 0 |
| 75 | 55,390 | 0 |
| 80 | 62,669 | 0 |
Figure 28. B) Net Annual Nominal Payments to Survivors of Scenario 5: Corporal without Allowances, with Superannuation PaymentsFootnote 39
 Graphic version")
| Age | Pension Act (dollars) | Enhanced New Veterans Charter (dollars) | ||||
|---|---|---|---|---|---|---|
| 0 Years of Service | 10 Years of Service | 30 Years of Service | 0 Years of Service | 10 Years of Service | 30 Years of Service | |
| 40 | 31,431 | 37,085 | 48,393 | 183,594 | 183,594 | 183,594 |
| 45 | 26,407 | 32,649 | 451,353 | 40,785 | 40,785 | 40,785 |
| 50 | 29,877 | 36,769 | 50,554 | 45,029 | 45,029 | 45,029 |
| 55 | 33,803 | 41,412 | 56,632 | 49,716 | 49,716 | 49,716 |
| 60 | 38,245 | 46,646 | 63,450 | 54,891 | 54,891 | 54,891 |
| 65 | 43,271 | 52,547 | 71,100 | 16,226 | 25,502 | 44,055 |
| 70 | 48,957 | 59,198 | 79,682 | 0 | 10,241 | 30,725 |
| 75 | 55,390 | 66,697 | 89,313 | 0 | 11,307 | 33,923 |
| 80 | 62,669 | 75,153 | 100,123 | 0 | 12,484 | 37,454 |
Points to Consider from Survivor Modelling for All Scenarios
A) Net Annual Nominal Payments to Survivors
- The New Veterans Charter compensates the survivor better overall than the Pension Act because of the lump sum Death Benefit and higher dollar value of the Extended Earnings Loss Benefit. The spike of almost $300,000 shows the effect of the Death Benefit in the first year of payments. Note that the Death Benefit is only provided if death is within 30 days of point of injury or illness. After 30 days, if the members or Veterans succumb to their service-related injury, they will be awarded the maximum Disability Award remaining. For example, if they were not in receipt of a Veterans Affairs Canada Disability Pension or Award, they would be assessed at 100 percent disability at time of death and receive the maximum Disability Award lump sum, which is the same dollar value as the Death Benefit. If on the other hand the member or Veteran was in receipt of a 25 percent Disability Pension or Award at the time of death, he or she would only receive a Disability Award of 75 percent, which is equivalent to 75 percent of the Death Benefit.
- The year the Veteran would have been 65, the Extended Earnings Loss Benefit ceases and the survivor receives no further income under the New Veterans Charter (other than the Supplementary Retirement Benefit), whereas the Pension Act continues to provide the survivor a monthly pension until the survivor dies. To note, since the Extended Earnings Loss Benefit ceases when the deceased member reaches the age of 65, this can have significant consequences for families where the spouse and/or children are dependents of an older Veteran. For example, a Veteran who has a child at age 50, but then dies at age 53 will leave the survivor in a situation where there are children in school and there are no further benefits forthcoming from the New Veterans Charter.
B) Net Annual Nominal Payments to Survivors with Superannuation Payments
The Canadian Forces Superannuation Act provides a payment to survivors based on the number of years of service of the deceased member. As this is another government benefit, it needs to be considered as part of the “whole-of-government effect” in the outcomes for survivors.
- At the age of 65, the Superannuation payments mitigate the effect of the lack of ongoing support for the Veteran under the New Veterans Charter.
- For Veterans under the Pension Act, the Superannuation payments are “stacked” on top of the Pension Act’s Survivor’s Pension, while under the New Veterans Charter, prior to age 65, the Superannuation payments are “integrated,” as they are used as an offset in calculating the Extended Earnings Loss Benefit. As a result, those survivors receiving higher levels of Superannuation compensation, when combined with the Pension Act’s Survivor’s Pension, may be better compensated overall than what the New Veterans Charter provides.
Comparison of Net Annual Payments of Provincial Workers’ Compensation Boards to Enhanced New Veterans Charter Payments
Workers’ Compensation Board benefits have been used to compare against those provided by the New Veterans Charter. However, the scope of the benefits provided under Workers’ Compensation Boards are provincially regulated and can vary greatly. The Office of the Veterans Ombudsman did a brief comparison of the net annual payments of provincial Workers’ Compensation Board financial benefits and the Enhanced New Veterans Charter financial benefits to provide some context as to whether this is a valid comparison. Note that this is not an in depth comparison of Workers’ Compensation Boards and the New Veterans Charter, but just a cursory examination to show the effect of using Workers’ Compensation Boards as a comparison and how provincial differences can greatly affect the outcomes. The analysis used Alberta and British Columbia to represent the provinces with the most generous compensation and Nova Scotia for the province with the least generous compensation. A comparison of the differences between provincial Workers’ Compensation Boards can be found in Comparison of Workers’ Compensation Benefits and Rehabilitation Services in Canada, 2013.
Figure 29. Scenario 1 – Corporal: Comparison of Net Annual Nominal Payments of Provincial Workers’ Compensation Boards to Enhanced New Veterans Charter Payments

| Age | Enhanced New Veterans Charter (dollars) | Nova Scotia (dollars) | British Columbia (dollars) | Alberta (dollars) |
|---|---|---|---|---|
| 24 | 288,397 | 21,256 | 42,447 | 93,843 |
| 29 | 4,681 | 25,407 | 45,772 | 29,237 |
| 34 | 60,372 | 26,796 | 49,358 | 31,933 |
| 39 | 66,655 | 28,260 | 53,225 | 34,878 |
| 44 | 73,591 | 29,805 | 57,395 | 38,095 |
| 49 | 81,251 | 31,434 | 61,892 | 41,608 |
| 54 | 89,707 | 33,152 | 66,741 | 45,446 |
| 59 | 99,044 | 34,964 | 71,970 | 49,637 |
| 64 | 109,353 | 36,875 | 77,608 | 54,215 |
| 69 | 76,565 | 19,092 | 17,059 | 39,326 |
| 74 | 84,533 | 20,136 | 18,395 | 42,953 |
| 79 | 93,331 | 21,236 | 19,837 | 46,914 |
Figure 30. Scenario 2 – Major: Comparison of Net Annual Nominal Payments of Provincial Workers’ Compensation Boards to Enhanced New Veterans Charter Payments

| Age | Enhanced New Veterans Charter (dollars) | Nova Scotia (dollars) | British Columbia (dollars) | Alberta (dollars) |
|---|---|---|---|---|
| 47 | 374,479 | 37,121 | 67,056 | 131,609 |
| 52 | 83,790 | 44,370 | 72,309 | 52,170 |
| 57 | 92,510 | 46,795 | 77,975 | 56,982 |
| 62 | 102,139 | 49,353 | 84,083 | 62,237 |
| 67 | 21,373 | 20,145 | 60,623 | 67,977 |
| 72 | 23,598 | 21,247 | 65,372 | 74,246 |
| 77 | 26,053 | 22,408 | 70,494 | 81,093 |
Figure 31. Scenario 3 – Captain: Comparison of Net Annual Nominal Payments of Provincial Workers’ Compensation Boards to Enhanced New Veterans Charter Payments

| Age | Enhanced New Veterans Charter (dollars) | Nova Scotia (dollars) | British Columbia (dollars) | Alberta (dollars) |
|---|---|---|---|---|
| 30 | 182,290 | 29,486 | 45,434 | 71,000 |
| 35 | 69,396 | 40,917 | 48,993 | 40,917 |
| 40 | 76,619 | 44,691 | 52,832 | 44,691 |
| 45 | 84,594 | 48,812 | 56,971 | 49,681 |
| 50 | 93,397 | 53,314 | 61,434 | 53,314 |
| 55 | 103,118 | 58,231 | 66,247 | 58,231 |
| 60 | 113,850 | 63,601 | 71,437 | 63,601 |
| 65 | 66,923 | 46,134 | 12,475 | 46,134 |
| 70 | 33,512 | 50,389 | 13,452 | 50,389 |
| 75 | 37,000 | 55,036 | 14,506 | 55,036 |
| 80 | 40,852 | 60,112 | 15,643 | 60,112 |
Figure 32. Scenario 4 – Sergeant: Comparison of Net Annual Nominal Payments of Provincial Workers’ Compensation Boards to Enhanced New Veterans Charter Payments

| Age | Enhanced New Veterans Charter (dollars) | Nova Scotia (dollars) | British Columbia (dollars) | Alberta (dollars) |
|---|---|---|---|---|
| 35 | 337,449 | 23,866 | 48,751 | 109,770 |
| 40 | 59,387 | 28,527 | 52,571 | 32,896 |
| 45 | 65,569 | 30,086 | 56,689 | 35,929 |
| 50 | 72,393 | 31,730 | 61,131 | 39,243 |
| 55 | 79,926 | 33,465 | 65,920 | 42,862 |
| 60 | 88,245 | 35,294 | 71,085 | 46,815 |
| 65 | 51,401 | 16,562 | 10,018 | 29,107 |
| 70 | 31,065 | 17,467 | 10,803 | 31,792 |
| 75 | 34,298 | 18,422 | 11,650 | 34,724 |
| 80 | 37,868 | 19,429 | 12,562 | 37,926 |
Figure 33. Scenario 5 – Corporal without Allowances: Comparison of Net Annual Nominal Payments of Provincial Workers’ Compensation Boards to Enhanced New Veterans Charter Payments

| Age | Enhanced New Veterans Charter (dollars) | Nova Scotia (dollars) | British Columbia (dollars) | Alberta (dollars) |
|---|---|---|---|---|
| 40 | 86,234 | 25,274 | 41,292 | 73,459 |
| 45 | 40,785 | 30,209 | 44,527 | 34,446 |
| 50 | 45,029 | 31,860 | 48,015 | 37,622 |
| 55 | 49,716 | 33,602 | 51,777 | 41,092 |
| 60 | 54,891 | 35,438 | 55,833 | 44,882 |
| 65 | 16,226 | 9,969 | 6,504 | 23,254 |
| 70 | 0 | 10,513 | 7,013 | 25,399 |
| 75 | 0 | 11,088 | 7,563 | 27,741 |
| 80 | 0 | 11,694 | 8,155 | 30,300 |
Points to Consider from the Comparison of Net Annual Payments of Provincial Workers’ Compensation Boards to Enhanced New Veterans Charter Payments
- Prior to age 65, the Enhanced New Veterans Charter provides better compensation than provincial Workers’ Compensation Boards.
- At age 65, the effect varies from province to province. However, for Scenario 5, the totally and permanently incapacitated Veteran not in receipt of any allowances (most financially at risk) will receive no further funding from the New Veterans Charter, while even the least generous provincial Workers’ Compensation Board provides for some level of income after age 65.
Footnotes
Footnote1. Section 20.1 of the Enhanced New Veterans Charter Act, S.C. 2011, c. 12 states: Within two years after the day on which this section comes into force, a comprehensive review of the provisions and operations of this Act must be undertaken by any committees of the Senate and of the House of Commons that are designated or established by the Senate and the House of Commons for that purpose. (Return)
Footnote2. Canadian Forces Members and Veterans Re-establishment and Compensation Act, S.C. 2005, c. 21. (Return)
Footnote3. Note that with changes to the New Veterans Charter that came into force in October 2011, the Veteran has the option of having the lump sum award disbursed over a number of years. (Return)
Footnote4. Canada Gazette. Vol. 139, No. 51, Canadian Forces Members and Veterans Re-establishment and Compensation Regulations. “Regulatory Impact Analysis Statement”. December 17, 2005.Source (Return)
Footnote5. Whole-of-government denotes public service agencies working across portfolio boundaries to achieve a shared goal and an integrated government response to particular issues. Approaches can be formal and informal and can focus on policy development, program management and service delivery. (Return)
Footnote6. Aon Hewitt is a leading global provider of risk management services, insurance and reinsurance brokerage, and human capital consulting. Aon Hewitt Canada offers a range of sophisticated advisory and consulting services in risk control and risk management, reinsurance, and human capital. The company designs, structures and implements solutions that may involve traditional insurance products or risk-transfer programs, alternative financing techniques, or entirely new products to address a specific problem, Aon Hewitt fact sheet. (Return)
Footnote7. Prior to acceptance of the Federal Court ruling, SISIP Long Term Disability ( LTD ) clients in receipt of a Pension Act Disability Pension had the total amount of the disability pension offset from the amount of the SISIP LTD income replacement benefit. The Disability Pension was also offset from the amount of the Veterans Affairs Canada Earnings Loss Benefit. With acceptance of the court ruling, the Disability Pension is no longer offset from the SISIP LTD benefit and the Veterans Affairs Canada Earnings Loss Benefit. Source (Return)
Footnote8. Alice Aiken and Amy Buitenhuis, Supporting Canadian Veterans with Disabilities: A Comparison of Financial Benefits, Defence Management Studies Program School of Policy Studies, Queen’s University in association with Canadian Institute for Military and Veterans Health Research, 2011. Source (Return)
Footnote9. Canada Gazette. Vol. 139, No. 51, Canadian Forces Members and Veterans Re-establishment and Compensation Regulations. “Regulatory Impact Analysis Statement”. December 17, 2005. Source (Return)
Footnote10. Idem . (Return)
Footnote11. Note that with changes to the New Veterans Charter that came into force in October 2011, the Veteran has the option of having the lump sum award disbursed over a number of years. (Return)
Footnote12. Federal Court, Ottawa, Ontario, May 1, 2012, Docket: T-463-07, Citation: 2012 FC 499, Between: Dennis Manuge, Plaintiff and Her Majesty the Queen, Defendant. Source (Return)
Footnote13. Federal Court, Ottawa, Ontario, April 4, 2013, Docket: T-463-07, Citation: 2013 FC 34, Between: Dennis Manuge, Plaintiff and Her Majesty the Queen, Defendant. Source (Return)
Footnote14. Federal Court, Ottawa, Ontario, May 1, 2012, Docket: T-463-07, Citation: 2012 FC 499, Between: Dennis Manuge, Plaintiff and Her Majesty the Queen, Defendant. Source (Return)
Footnote15. Matt Gurney, “A long-delayed victory for Canada’s veterans UPDATED: Government responds,” National Post, May 5, 2012. Source (Return)
Footnote16. A similar desired outcome can be found on page four of the Standing Senate Committee on National Security and Defence's ninth report, entitled A Study of the New Veterans Charter, March 2013. Source (Return)
Footnote17. The official title of the New Veterans Charter rehabilitation program is “Rehabilitation Services and Vocational Assistance Program.” Rehabilitation services include medical, psycho-social and vocational interventions. (Return)
Footnote18. This is a result of the fact that on average women live longer so they would have a longer period of time to receive a monthly pension as compared to a man. This effect is lost in the New Veterans Charter because the Disability Award is a lump sum payment. (Return)
Footnote19. All demographic statistics used in this analysis were provided by Veterans Affairs Canada as of March 2013. (Return)
Footnote20. Veterans Affairs Canada defines the term “totally and permanently incapacitated” as a Veteran who is incapacitated by a permanent physical or mental health problem that prevents the Veteran from performing any occupation that would be considered to be suitable gainful employment. The inability to work must be due to the health problem(s) for which rehabilitation services were approved. Suitable and gainful employment is employment for which the Veteran is reasonably qualified by reason of education, training or experience and that provides a monthly rate of pay equal to at least 66⅔ percent of the imputed income of the Veteran. (Return)
Footnote21. Although the focus of this analysis is on Canadian Forces Veterans, it should be noted that some of the points identified may be applicable to War Service and RCMP Veterans. (Return)
Footnote22. Some Veterans are also receiving a Pension Act Disability Pension but these payments are for pain and suffering and are not considered as income. Accordingly, the Disability Pension is not included in determining who is at risk financially. (Return)
Footnote23. The Permanent Impairment Allowance compensates for the lack of career opportunities and progression, and is paid in three grades: Grade 1 - $1,709.27, Grade 2 - $1,139.52, Grade 3 - $569.76. The Permanent Impairment Supplement compensates for the inability to perform any occupation that is considered to be suitable gainful employment and equals $1,047.53. All values are for year 2013. Ninety-one percent of Veterans who receive the Permanent Impairment Allowance receive Grade 3. Both the Permanent Impairment Allowance and Permanent Impairment Allowance Supplement are taxable and are paid monthly for life. (Return)
Footnote24. There are 44 Veterans who are not receiving allowances due to their totally and permanently incapacitated designation as a result of a non-service related injury or illness. (Return)
Footnote25. The Office of the Ombudsman’s actuarial tool was developed by Aon Hewitt to allow various parameters about a Veteran or a group of Veterans to be inputted into a specially designed spreadsheet in which calculations are done using actuarial methodology and tables to produce actuarial outcomes. These outcomes are displayed both as tables and charts. (Return)
Footnote26. Veterans Affairs Canada defines the term “totally and permanently incapacitated” as a Veteran who is incapacitated by a permanent physical or mental health problem that prevents the Veteran from performing any occupation that would be considered to be suitable gainful employment. The inability to work must be due to the health problem(s) for which rehabilitation services were approved. Suitable and gainful employment is employment for which the Veteran is reasonably qualified by reason of education, training or experience, and that provides a monthly rate of pay equal to at least 66⅔ percent of the imputed income of the Veteran. (Return)
Footnote27. Although the tool has the ability to do aggregate (groups of Veterans) modelling, it requires that the parameters for every Veteran in a particular grouping be inputted into the model. Due to the difficulty of obtaining specific data (e.g., salary, years of service, etc.) some assumptions have to be made with aggregate modelling. As a result, the aggregate results will not be as precise, but can still provide a rough order of magnitude costing for some scenarios, or provide a ratio of costs when compared. Solutions that require factoring in Canadian Forces Superannuation payments (which are used as an offset in calculating Earnings Loss Benefits) cannot be costed on an aggregate basis as the determinant for that costing requires the years of service of Veterans, which is not consistently recorded in the Veterans Affairs Canada statistical database. (Return)
Footnote28. The data used in the modelling of all scenarios in this analysis was provided by Veterans Affairs Canada as of March 13, 2013. (Return)
Footnote29. Because the Veteran in Scenario 1 is assessed a disability level of 80%, the increase to his Disability Award will be 80% of the hypothetical new maximum (i.e. $280,000). (Return)
Footnote30. Section 20.1 of the Enhanced New Veterans Charter Act, S.C. 2011, c. 12 states: Within two years after the day on which this section comes into force, a comprehensive review of the provisions and operations of this Act must be undertaken by any committees of the Senate and of the House of Commons that are designated or established by the Senate and the House of Commons for that purpose. (Return)
Footnote31. N. Gregory Mankiw, Macroeconomics (5th ed.) (Worth Publishers, 2002), pp. 22–32, 978-0716752370. (Return)
Footnote32. David Dickson, Actuarial Mathematics for Life Contingent Risks (Cambridge University Press, 2009), pp. 145–146, ISBN 9780521118255. (Return)
Footnote33. Canada Gazette. Vol. 139, No. 51, Canadian Forces Members and Veterans Re-establishment and Compensation Regulations “Regulatory Impact Analysis Statement”. December 17, 2005. (Return)
Footnote34. Idem . (Return)
Footnote35. This figure shows the net annual nominal payments for Veterans with the Scenario 1 Corporal’s disability assessment level, age, rank, salary and gender but with varying years of service. (Return)
Footnote36. This figure shows the net annual nominal payments for Veterans with the Scenario 2 Major’s disability assessment level, age, rank, salary and gender but with varying years of service. (Return)
Footnote37. This figure shows the net annual nominal payments for Veterans with the Scenario 3 Captain’s disability assessment level, age, rank, salary and gender, but with varying years of service. (Return)
Footnote38. This figure shows the net annual nominal payments for Veterans with the Scenario 4 Sergeant’s disability assessment level, age, rank, salary and gender, but with varying years of service. (Return)
Footnote39. This figure shows the net annual nominal payments for Veterans with the scenario 5 Corporal’s disability assessment level, age, rank, salary and gender but with varying years of service. (Return)